

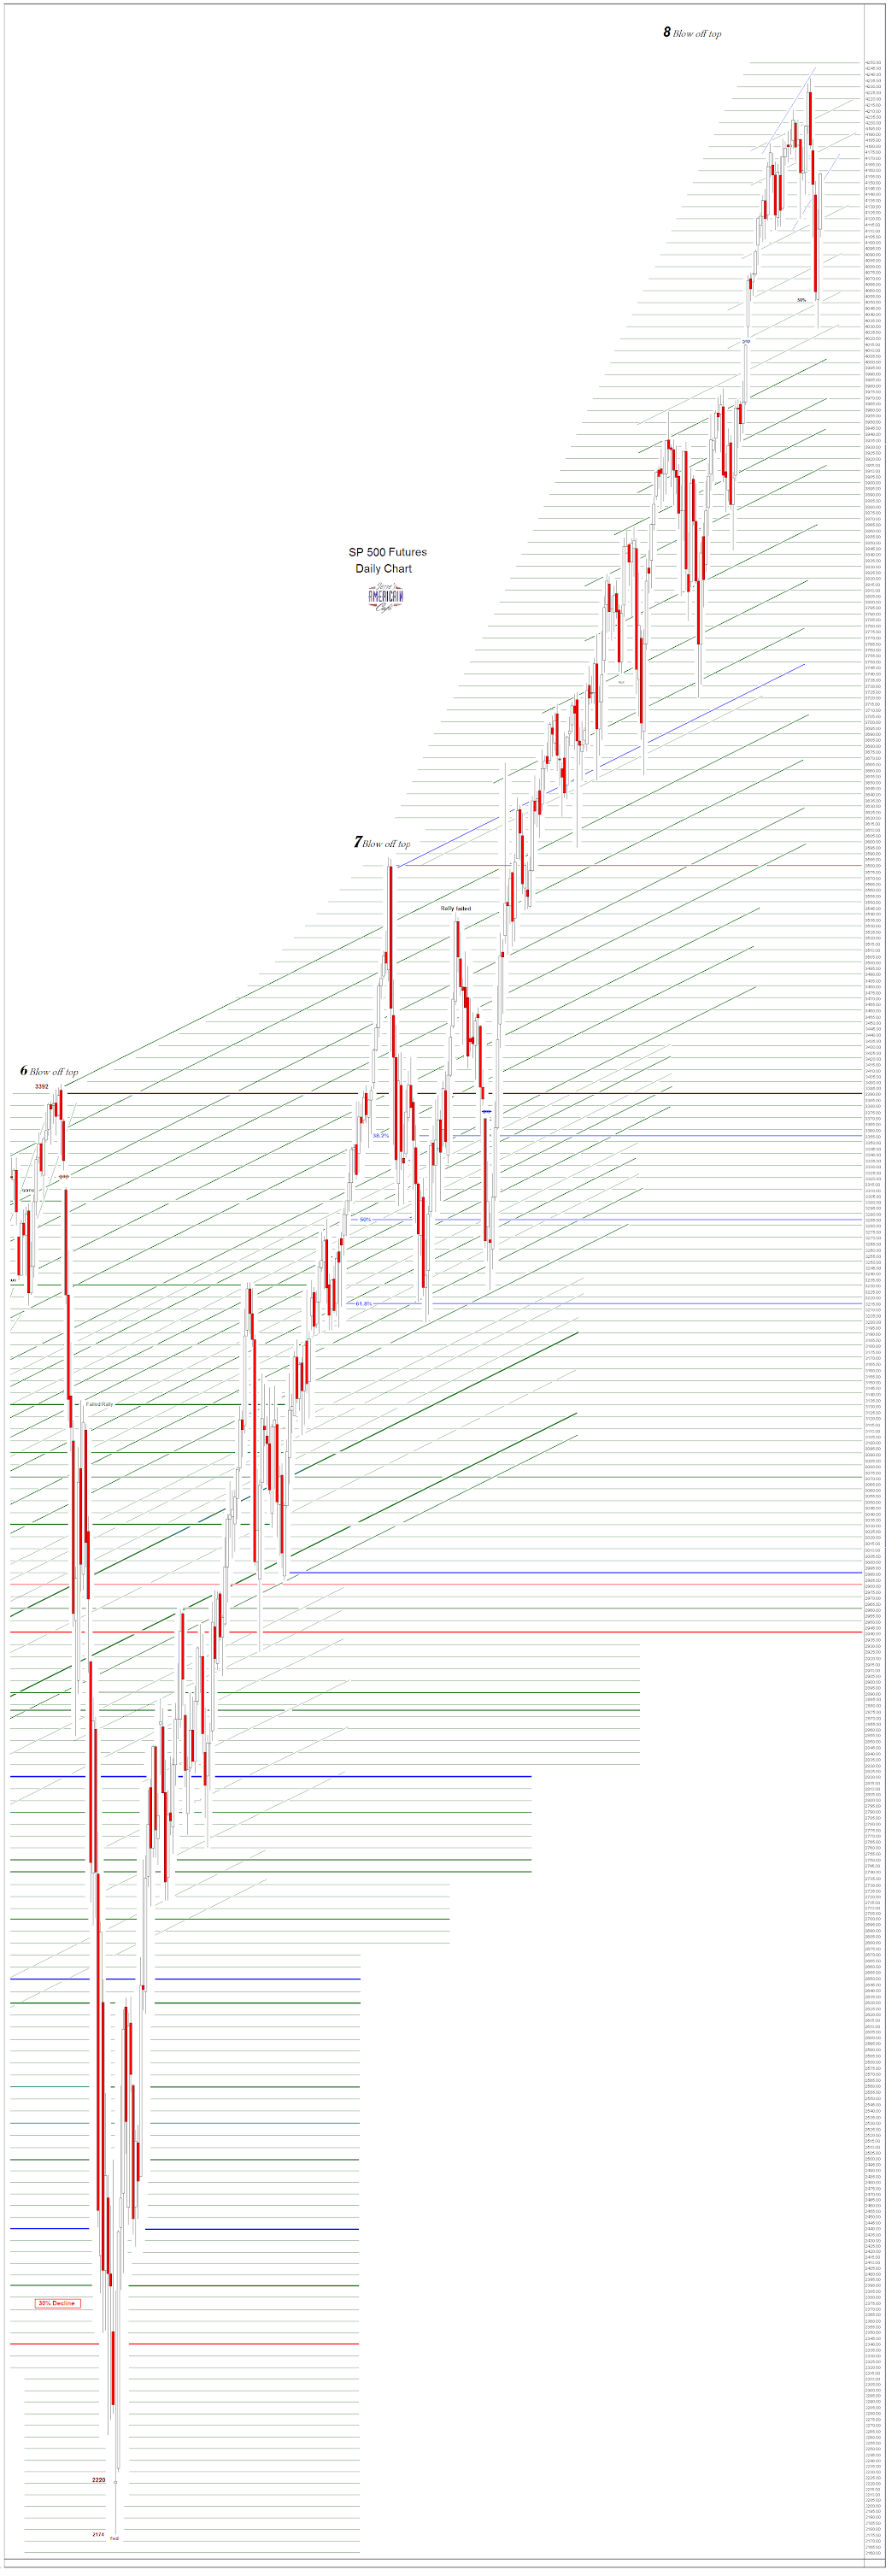
Here is a shot of the SP 500 chart in its original size.
You can more easily see the bounce off the 50% Fibonacci retracement.
These are the charts as I use them each day I also have the ability to 'zoom in' on even the smallest sections.
I realized yesterday I am going to have to cut the charts off a bit to let you see them more easily each day.
(Click on image to enlarge)

Comments
Log in or sign up to join the conversation.