
The financial markets remain volatile as inflation, supply chain issues, and serious geopolitical events cloud the immediate future.
This volatility has manifested itself into a bearish descending triangle on the broad U.S. stock market index the S&P 500.
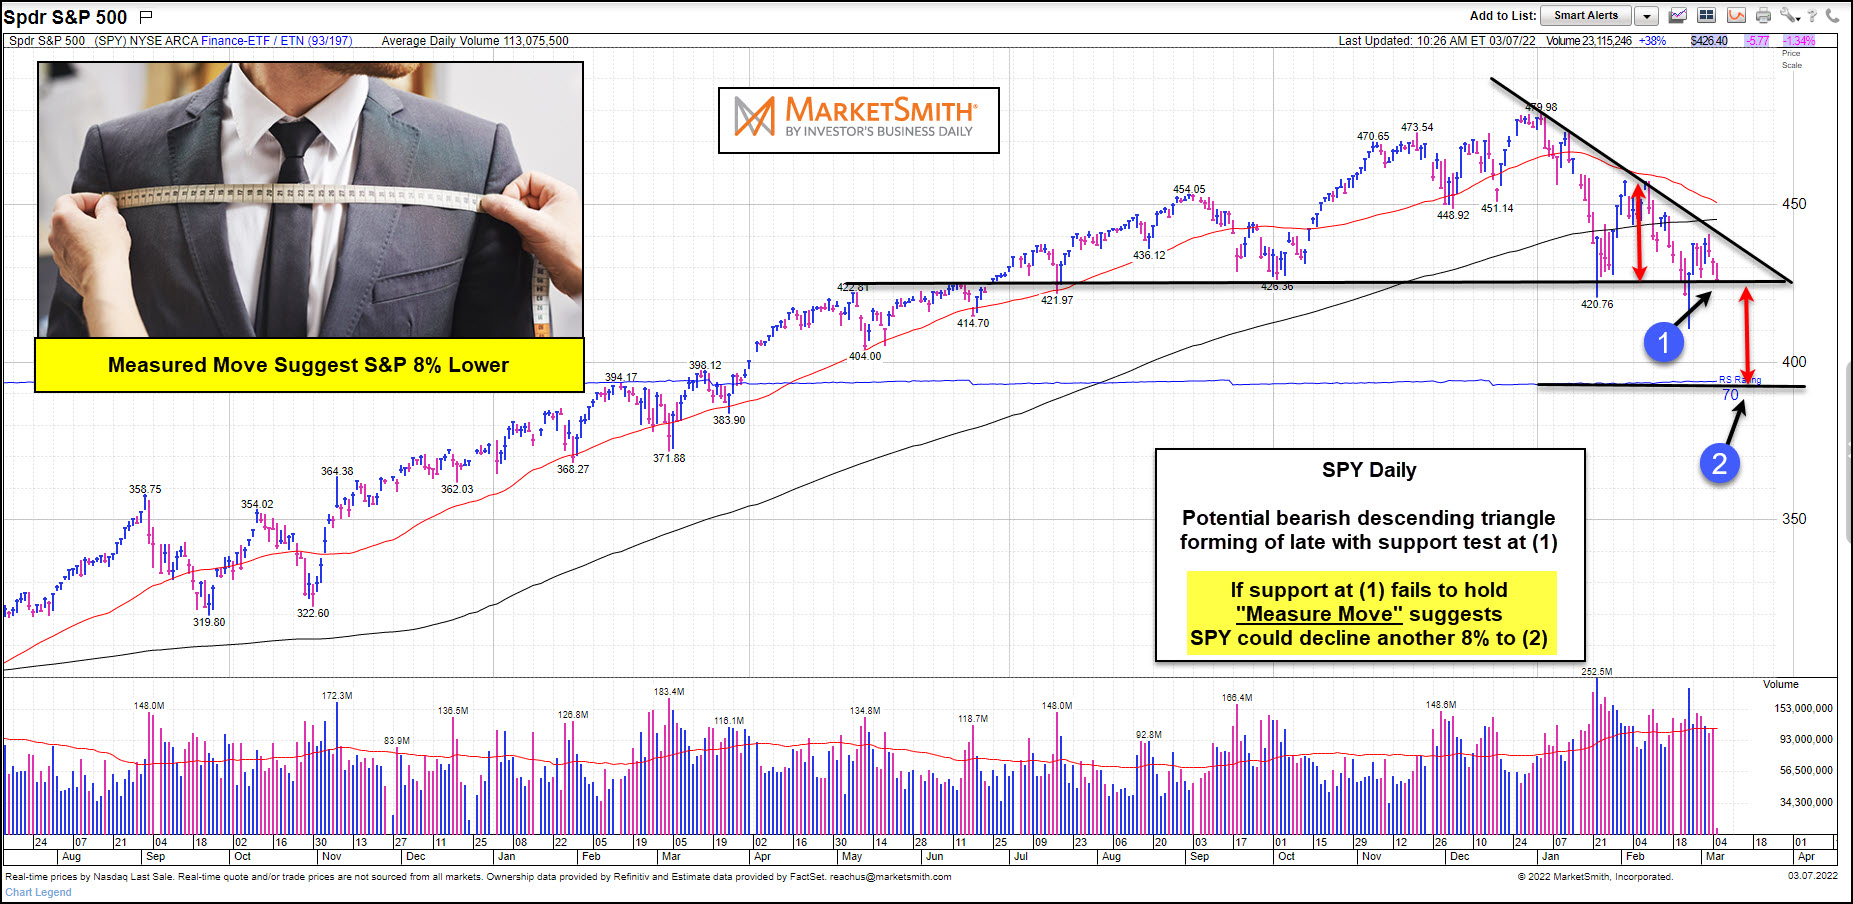
Looking at the chart below (of the S&P 500 ETF SPY), we can see this triangle formation. Note the height of the last rally via the upper red arrows, as well as the major price support area at line (1).
Is the stock market selloff over?
Well, this support line may very well be our tell. If support at (1) fails to hold, a “measured move” suggests that the S&P 500 ETF could fall another 8 percent to (2).
A move like this would further rattle the financial markets and perhaps your portfolio. Stay tuned!
(Click on image to enlarge)


Comments
Log in or sign up to join the conversation.