


In this technical article, we’ll look at the Soybean Futures (ZS_F) Elliott Wave charts published in our members’ area. ZS_F continues to show incomplete bearish sequences from the September 11 peak, pointing to further downside in the near term. Let’s break down the Elliott Wave structure and explore the latest outlook for ZS_F.
ZS_F Elliott Wave 1 Hour Chart 10.13.2026
ZS_F is forming a 3-wave correction against the 1309'1 peak, with the recovery taking the shape of an Elliott Wave Zigzag. The first leg, wave (a) red, appears to be a clear 5-wave impulsive move, followed by a 3-wave pullback in wave (b) red. We are now looking for another leg higher in wave (c) red, which should also unfold in 5 waves to complete the wave (x) blue recovery.
The target area for wave (x) blue to complete is 1308'6–1315'4, where we expect the recovery to end and the downside to resume.
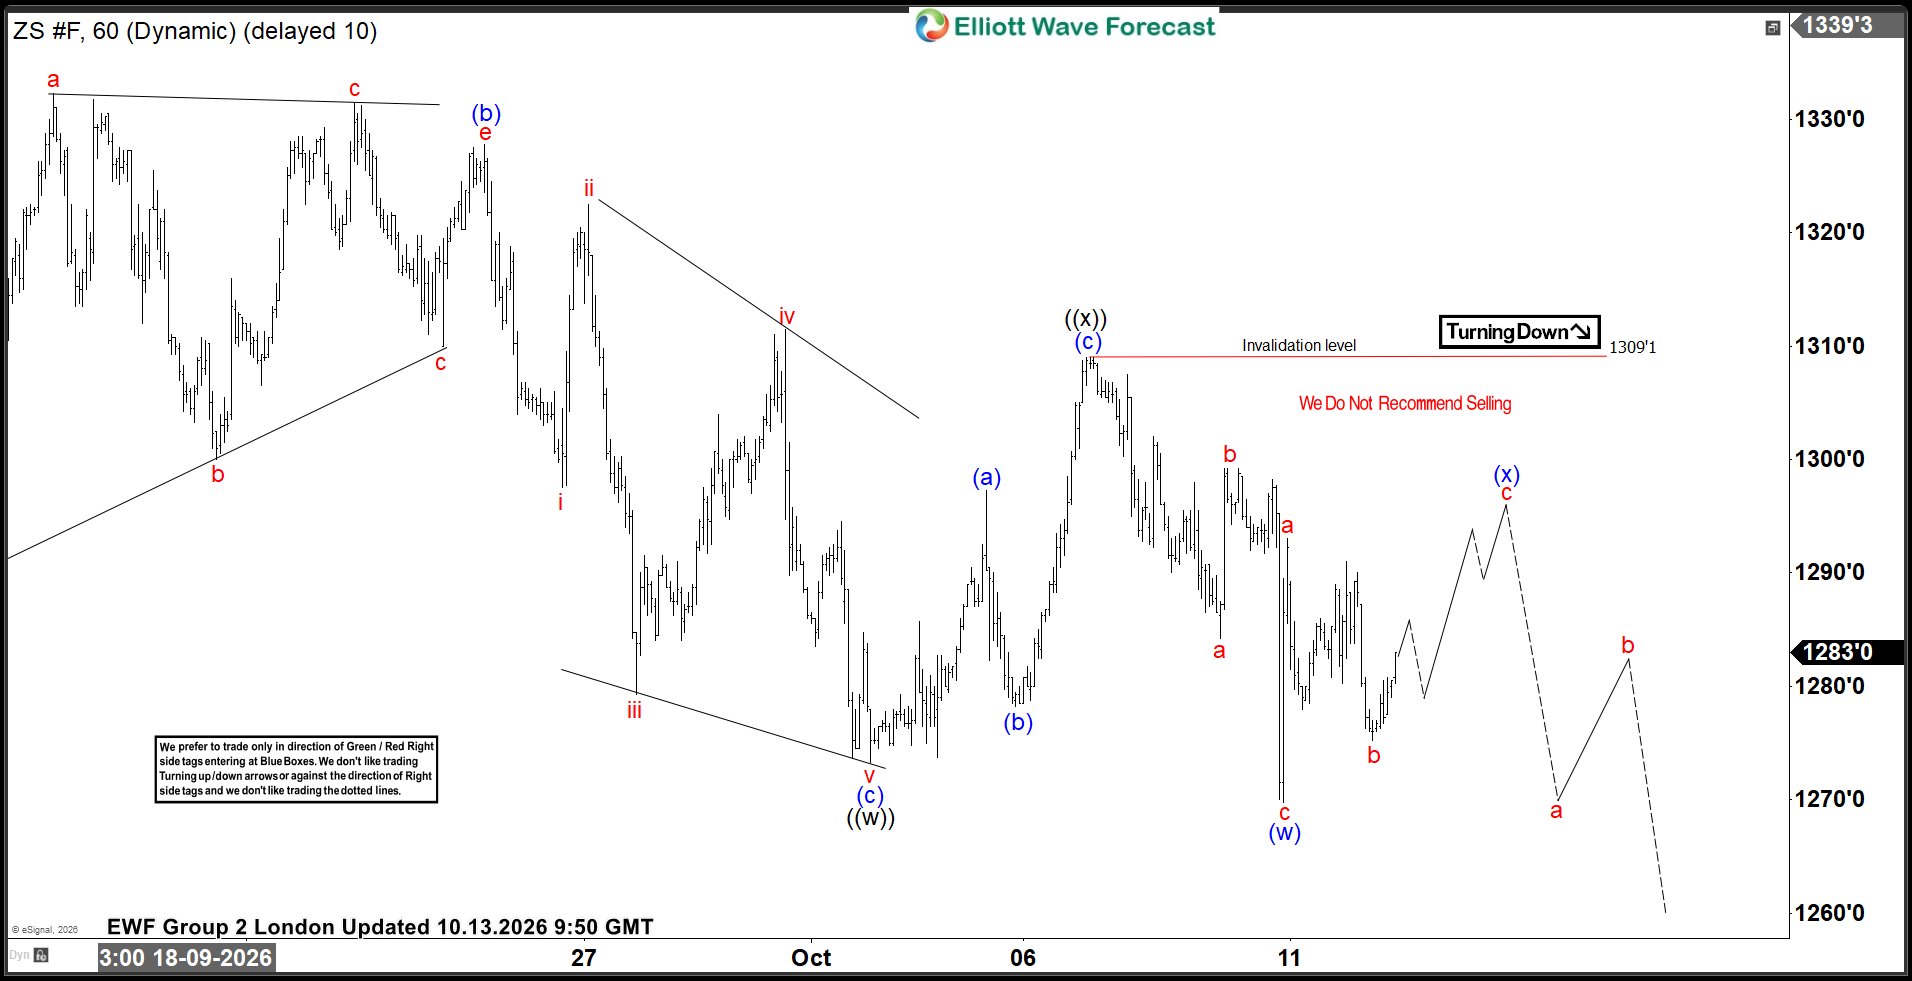
ZS_F Elliott Wave 1 Hour Chart 10.13.2026
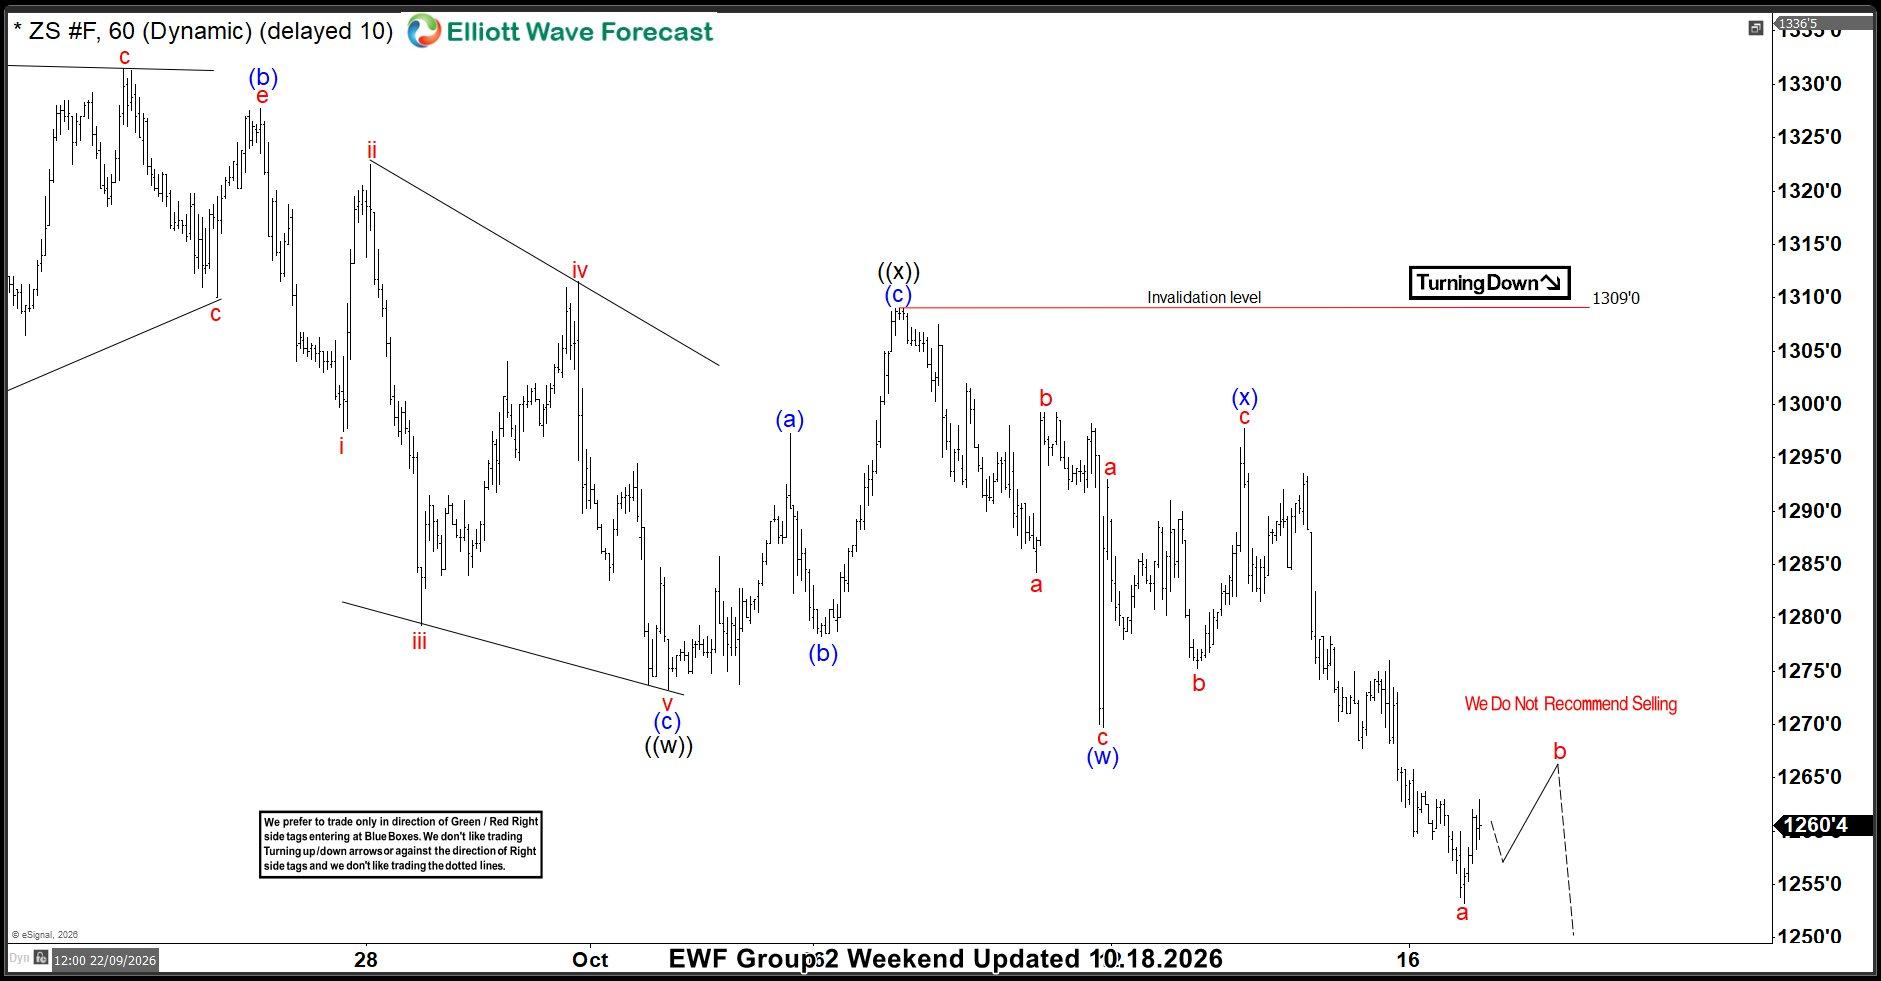
ZS_F made another leg higher within the (x) blue recovery, as expected. Wave c red delivered a sharp rally unfolding in a clear 5-wave structure. The commodity then completed the Elliott Wave Zigzag pattern and turned lower, in line with our forecast. As long as the bearish sequence remains intact, ZS_F is targeting the 1247'0 area.
Keep in mind that the market is dynamic and the presented view could have changed in the meantime. You can check the most recent charts with target levels in the membership area of the site. The best instruments to trade are those having incomplete bullish or bearish swing sequences.
Source:



Comments
Log in or sign up to join the conversation.