
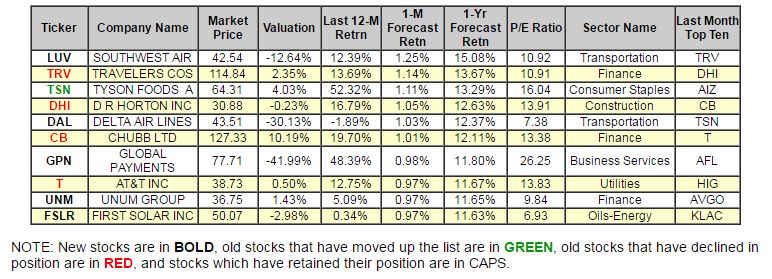
For June, we see a 50% turnover in our list. Traveler's has finally been dethroned from its longtime top spot by newcomer Southwest Airlines. DR Horton, Chubb, and AT&T also declined a few positions. Poultry giant Tyson has moved up while AIZ, AFL, HIG, AVGO, and KLAC have fallen out of the top-ten list. Other newcomers this week include Delta Airlines, Global Payments, UNUM Group, and First Solar.
(Click on image to enlarge)
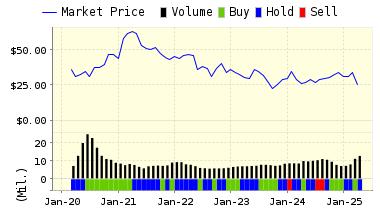
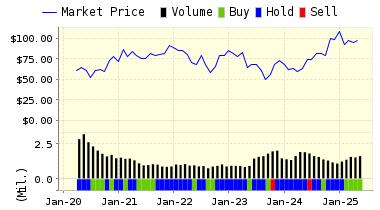
Below is today's data on our new SP500 leader, Southwest Airlines (LUV):
Southwest Airlines is a major domestic airline that provides primarily shorthaul, high-frequency, point-to-point, low-fare service. Southwest operates over Boeing 737 aircraft in numerous cities. Southwest has the lowest operating cost structure in the domestic airline industry and consistently offers the lowest and simplest fares. Southwest also has one of the best overall Customer Service records.

Recommendation: We continue with a STRONG BUY recommendation on SOUTHWEST AIR for 2016-06-01. Based on the information we have gathered and our resulting research, we feel that SOUTHWEST AIR has the probability to OUTPERFORM average market performance for the next year. The company exhibits ATTRACTIVE Company Size and Sharpe Ratio.
|
ValuEngine Forecast |
||
|
Target |
Expected |
|
|---|---|---|
|
1-Month |
43.07 | 1.25% |
|
3-Month |
43.40 | 2.02% |
|
6-Month |
43.22 | 1.60% |
|
1-Year |
48.96 | 15.08% |
|
2-Year |
41.64 | -2.12% |
|
3-Year |
32.48 | -23.65% |
|
Valuation & Rankings |
|||
|
Valuation |
12.64% undervalued |
Valuation Rank |
|
|
1-M Forecast Return |
1.25% |
1-M Forecast Return Rank |
|
|
12-M Return |
12.39% |
Momentum Rank |
|
|
Sharpe Ratio |
0.92 |
Sharpe Ratio Rank |
|
|
5-Y Avg Annual Return |
25.57% |
5-Y Avg Annual Rtn Rank |
|
|
Volatility |
27.81% |
Volatility Rank |
|
|
Expected EPS Growth |
8.38% |
EPS Growth Rank |
|
|
Market Cap (billions) |
28.87 |
Size Rank |
|
|
Trailing P/E Ratio |
10.92 |
Trailing P/E Rank |
|
|
Forward P/E Ratio |
10.07 |
Forward P/E Ratio Rank |
|
|
PEG Ratio |
1.30 |
PEG Ratio Rank |
|
|
Price/Sales |
1.43 |
Price/Sales Rank |
|
|
Market/Book |
4.42 |
Market/Book Rank |
|
|
Beta |
1.02 |
Beta Rank |
|
|
Alpha |
0.14 |
Alpha Rank |
Market Overview
|
Summary of VE Stock Universe |
|
|
Stocks Undervalued |
52.65% |
|
Stocks Overvalued |
47.35% |
|
Stocks Undervalued by 20% |
22.79% |
|
Stocks Overvalued by 20% |
14.93% |
Sector Overview
|
Sector |
Change |
MTD |
YTD |
Valuation |
Last 12-MReturn |
P/E Ratio |
|
Consumer Staples |
0.62% |
0.65% |
5.55% |
6.34% overvalued |
2.75% |
23.55 |
|
Utilities |
-0.15% |
-0.10% |
5.88% |
5.53% overvalued |
-1.07% |
22.91 |
|
Oils-Energy |
0.46% |
0.57% |
11.76% |
4.85% overvalued |
-33.49% |
23.77 |
|
Multi-Sector Conglomerates |
0.01% |
0.05% |
4.53% |
4.68% overvalued |
-10.33% |
18.05 |
|
Basic Materials |
-0.15% |
-0.12% |
26.37% |
4.52% overvalued |
8.74% |
29.33 |
|
Industrial Products |
0.24% |
0.28% |
6.05% |
2.90% overvalued |
-10.12% |
21.49 |
|
Aerospace |
0.19% |
0.25% |
-2.19% |
1.04% overvalued |
-4.84% |
18.75 |
|
Computer and Technology |
0.31% |
0.39% |
7.66% |
0.25% overvalued |
-8.92% |
27.89 |
|
Business Services |
0.40% |
0.46% |
11.99% |
0.55% undervalued |
-8.49% |
22.99 |
|
Finance |
0.15% |
0.19% |
2.41% |
0.90% undervalued |
-4.84% |
16.00 |
|
Consumer Discretionary |
0.38% |
0.42% |
2.93% |
1.34% undervalued |
-10.90% |
22.67 |
|
Construction |
-0.20% |
-0.15% |
20.93% |
2.03% undervalued |
-4.46% |
20.52 |
|
Medical |
0.68% |
0.79% |
-4.65% |
3.59% undervalued |
-19.52% |
27.12 |
|
Auto-Tires-Trucks |
-0.30% |
-0.27% |
-0.53% |
8.15% undervalued |
-17.51% |
11.90 |
|
Transportation |
-0.20% |
-0.16% |
1.60% |
8.80% undervalued |
-28.23% |
13.62 |
|
Retail-Wholesale |
0.23% |
0.29% |
-3.38% |
11.04% undervalued |
-11.71% |
21.97 |
Valuation Watch: Overvalued stocks now make up 47.35% of our stocks assigned a valuation and 13.6% of those equities are calculated to be overvalued by 20% or more. Eight sectors are calculated to be overvalued.
Comments
Log in or sign up to join the conversation.