

Some NBER BCDC key indicators have peaked, as noted in this post. The more volatile manufacturing sector is showing stress as well.
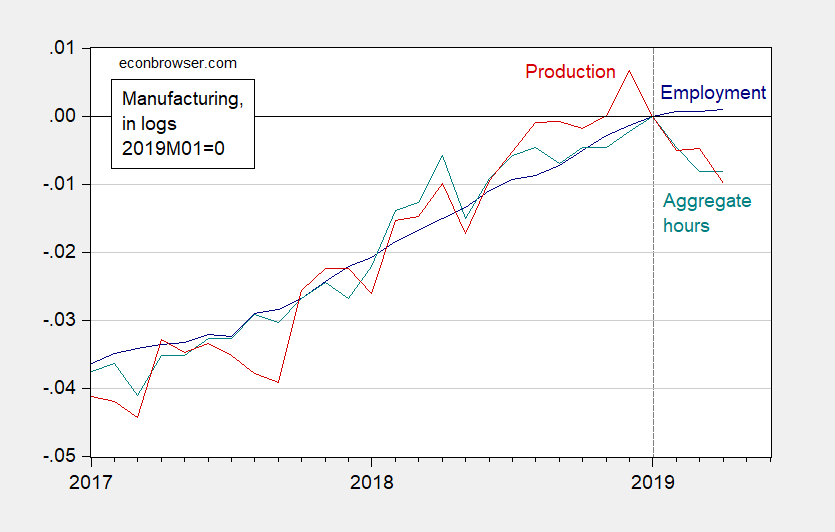
Figure 1: Employment in manufacturing (blue), aggregate hours of nonsupervisory and production workers in manufacturing (teal), and manufacturing production (red), all in logs, 2019M01=0. Source: BLS, Federal Reserve via FRED, and author’s calculations.
Durable manufacturing has witnessed an even more precipitous decline.
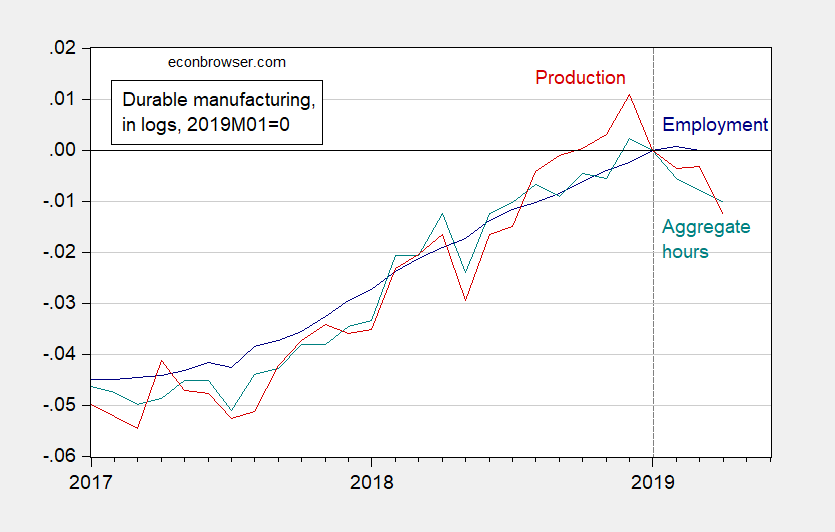
Figure 2: Employment in durable goods production (blue), aggregate hours of nonsupervisory and production workers in durable goods production (teal), and durable manufacturing production (red), all in logs, 2019M01=0. Source: BLS, Federal Reserve via FRED, and author’s calculations.
Returning to overall manufacturing, it seems that sector data compiled by BLS confirms the downturn (value added by industry data is still rising as of 2018Q4).

Figure 3: Real output in manufacturing (blue) and real value added (red), in logs 2018Q4=0. Source: BLS productivity and costs release, and BEA GDP by industry release, and author’s calculations.



Comments
Log in or sign up to join the conversation.