

Currency appreciation will be a drag; this implies a policy of slower monetary tightening is in order
The Dollar’s Rise In Context
The dollar has risen by over 20% (log terms) against major currencies since July, as of 3/13. Against the euro, the dollar has appreciated by over 25%.
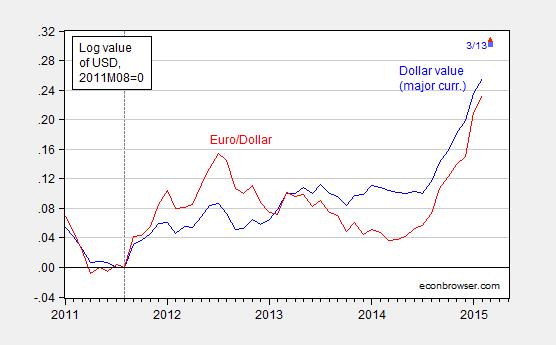
Figure 1: Log value of US dollar against basket of major currencies (blue), and against euro (red), normalized to August 2011. Values for March pertain to 3/13. Source: Federal Reserve Board via FRED, and author’s calculations.
The angst concerning the dollar, in particular the drag induced by expenditure switching (reduced exports, increased imports), is reflected in many accounts, including U.S. economy’s surprise risk: The dollar’s surge could weaken growth:
The surging value of the U.S. dollar promises new bargains for American consumers and travelers but also presents big threats to the U.S. economy — in a trend that is shaping up to be one of the most unexpected and significant factors driving the global economy this year.
…
The unexpected surge has led economists to reduce their expectations for U.S. economic growth this spring; this week, it pushed markets into negative territory for the year. It’s happening largely because the U.S. economy has been unusually strong amid a global slowdown, giving the dollar an advantage over other currencies.
I would take issue with the assertion that the induced drag was a surprise. Analysts had worried about the appreciating dollar back last year, when the surge was already apparent.
The article makes clear that it’s the real value of the dollar that’s relevant. Figure 2 presents a longer view on the dollar’s real value.
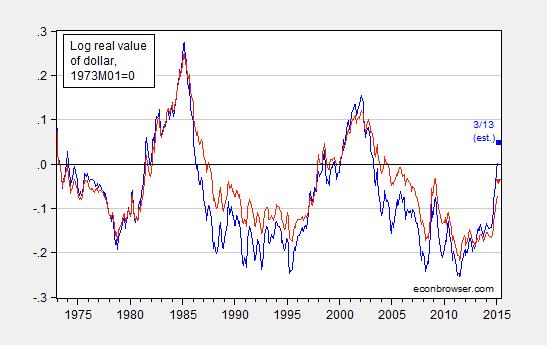
Figure 2: Log real value (CPI deflated) of US dollar against basket of major currencies (blue), and against broad basket (red), normalized to March 1973. Values for March pertain to 3/13, and assume that the real appreciation from February to March equals that for nominal (i.e., inflation differentials are the same). Source: Federal Reserve Board via FRED, and author’s calculations.
Note that the broader index is probably more relevant, given the importance US trade with China (which is not in the major index).
Figure 2 makes two points clear. First, the appreciation over the past six months is very rapid. Second, the appreciation is not unprecedented; however, the last such episode – during the post-Lehman flight to safety – was short-lived. Before that, it was in the wake of the East Asian crises. That episode augurs ill to the extent it presaged a long period of widening trade deficits (although with rapid growth).
Implications for Trade Flows and Growth
The US trade deficit has shrunk considerably since its peak of 5.9% of GDP in 2005Q4. It was 3.1% of GDP as of 2014Q4 (second release). The non-oil trade deficit has exhibited a much smaller decrease; the 3.8% deficit has shrunk to 2.1% as of last quarter. Notice that the real value of the dollar, lagged two years, has an inverse relationship with the trade balance. Hence, eventually, it makes sense that the deficit will eventually deteriorate (relative to counterfactual) as a consequence of the recent appreciation.
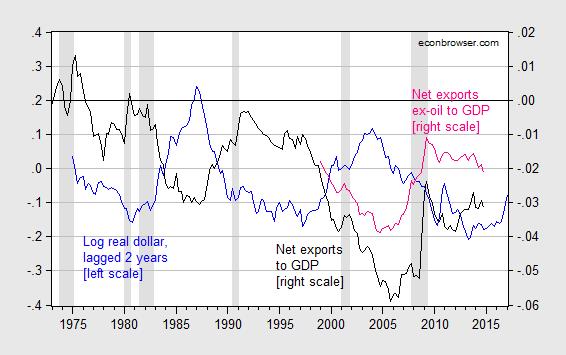
Figure 3: Log real (CPI deflated) value of US dollar against basket of major currencies, 1973M03=0 (blue, left scale), net exports as share of GDP (black, right scale), and net exports ex.-oil (pink, right scale). Note 2015Q1 value of the dollar based on January and February data. NBER defined recession dates shaded gray. Source: Federal Reserve Board via FRED, BEA NIPA (2014Q4 second release) and trade releases, and author’s calculations.
The recent deterioration in the ex-oil trade balance indicates that the dollar isn’t the only determinant. (And, in fact, a better measure of competitiveness would be a productivity adjusted real value of the dollar; such a series does not available for a basket of currencies that includes the yuan. For more, see this paper).
Obviously, domestic economic activity (for instance partly indicated by the recession dates) is important to changes in the trade balance. Foreign economic activity is as well, although that factor is not shown in the graph.
While Figure 3 is suggestive, we would want to know more than the impact on the trade balance to GDP ratio (keeping in mind exports, imports and GDP all respond to the real exchange rate). This leads to the next section.
A Static, Partial Equilibrium, Back of the Envelope Estimate
As in previous instances, I rely on statistical models of trade flows, taking into account at a superficial level vertical specialization and heterogeneity. Imports depend on domestic GDP and the real value of the currency; exports depend on foreign economic activity and the real value of the currency. Since oil imports and agricultural exports are primarily denominated in dollars, I omit these flows from the calculations.
In this paper, I find the long run (in a statistical sense) elasticity of nonagricultural exports of goods with respect to the real exchange rate is 0.690 (Table 1), and nonpetroleum imports of goods elasticity is 0.446. These estimates are obtained using dynamic OLS (DOLS), following Stock and Watson (1993). Assuming the 20% appreciation is sustained, then exports are about 13.8% lower than they otherwise would be, and imports about 8.9% higher.
Given that nonagricultural exports are 1349 billion Chained 2009$ (SAAR), and nonpetroleum imports are 1976 billion Chained 2009$ in 2014Q4, then such changes would be equivalent to 174 and 184 bn Ch.09$ at annual rates. This implies about a 2% decrease in the level of real GDP, relative to what it otherwise would be. Obviously, the impact of the 20% appreciation would take some time to affect flows, so the impact on GDP growth would be relatively small.
Goldman Sachs (GS), in a March 9th note, argues that the drag arising from dollar appreciation should be about one-half percentage point of growth over the next two to three years. That is equivalent to something slightly smaller than the 2 percentage point lower level of GDP relative to baseline.
What Is to Be Done?
There are many caveats to the above static, partial equilibrium, analysis. Scott Sumner for instance argues that one should be careful about partial equilibrium analysis. While this is wise advice in general, in my view is there is, from a statistical standpoint, a very large exogenous component to exchange rate movements (that’s partly why exchange rates are so hard to predict). Expectations of euro monetary easing or (following Krugman) persistent slow growth in the euro area, are largely out of the control of American policymakers, and are be largely affected by US growth rates.
So, I would say the logical conclusion is that policymakers should put a higher weight than they have heretofore on foreign developments, and in particular, the value of the dollar. One way they can weaken the dollar relative to the counterfactual (I know many readers don’t believe in such things, but this is the right way to think about it) is, given the policy rate is essentially at zero, to maintain an accommodative stance in terms of forward guidance.
As I noted in this post, the correlation between the euro-dollar exchange rate and the US-euro area shadow policy rate differential is pretty apparent. Here is an updated version of the earlier graphs.
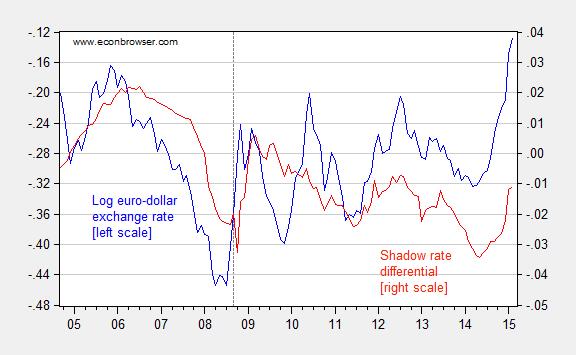
Figure 4: Log euro-dollar exchange rate (blue, left scale), up is dollar appreciation; and US-euro area shadow policy rate differential (red, right scale). Source: Federal Reserve Board via FRED, and Wu and Xia, and author’s calculations.
Delaying the lift-off would serve to maintain growth, with no appreciable risk of inflation.



Comments
Log in or sign up to join the conversation.