

Last week ended on a strong note for the members of the Modern Family who were already leading. The laggards IBB and KRE continue to slip.
Grandpa Russell, IWM, also ended the week on a weak note, but it sits at good support created by the trendline from the March lows and the swing high on June 8. You'll see these lines on the weekly charts below.
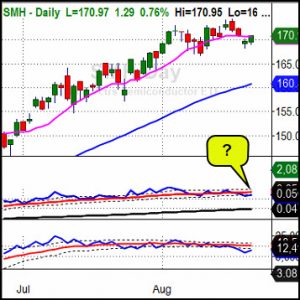
Before we take a look at the Modern Family on a big picture weekly basis, let's take a look at the today's featured image above, and the chart below which represent Sister Semi, SMH, who has been one of the leaders of the market since the March low.
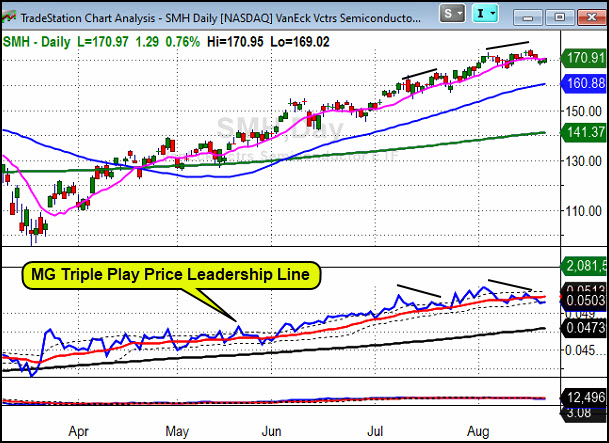
The MG triple play price leadership line in the chart represents a measure of the strength of SMH leadership. When the blue line is over the red line, it's bullish; when it's under the red line, it's bearish.
There are two patterns to take note of in this chart.
- The magenta line on the price chart is the 10 DMA. Notice how every time SMH dipped below the 10 DMA and recovered, it created a new swing low that has never been broken.
- Until July, every new high in the SMH has been accompanied by a new high in the Triple Play Price Leadership Line. This week SMH broke below its 10 DMA, and the leadership line broke below its red DMA after failing to make a new high with the SMH price new high company.
What happens next will determine whether the SMH remains a bullish leader or an indicator of bearish rotation out of semiconductors.
The combination of these two patterns means that a break below Thursday's low will be negative in SMH, and a break below the August swing low would indicate a more serious bearish swing low.
If this happens, the market is going to need some new leadership. Let's take a look at the weekly picture of the Modern Family to see if it can help.
Below you'll see the Modern Family weekly charts along with a Triple Play Leadership line.
You may also want to refer to the long-term closing line charts presented here recently in conjunction with this view below. You can find those charts here.
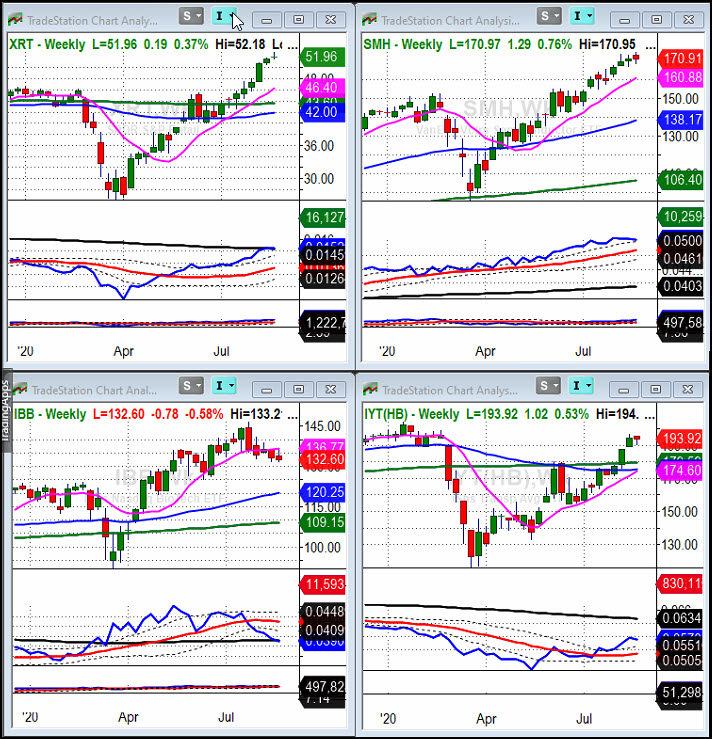
In the chart above, take note that SMH is still quite strong on a weekly basis, so a correction on a daily basis isn't an obvious long term top.
As we've been saying for weeks, XRT has been incredibly strong. This suggests that there could be cyclical strength too replace technical weakness when the market rotates.
Another example of this is the strength in IYT.
Biotech, IBB, has been weak for weeks, but what you can't see in this chart is that it's sitting on support created by its previous long term swing highs from 2015. This will be bullish if it turns higher, however, right now, the daily trend is down, and it's daily and weekly triple play price leadership measure is bearish.
I'm not counting on IBB to become a new bullish leader.
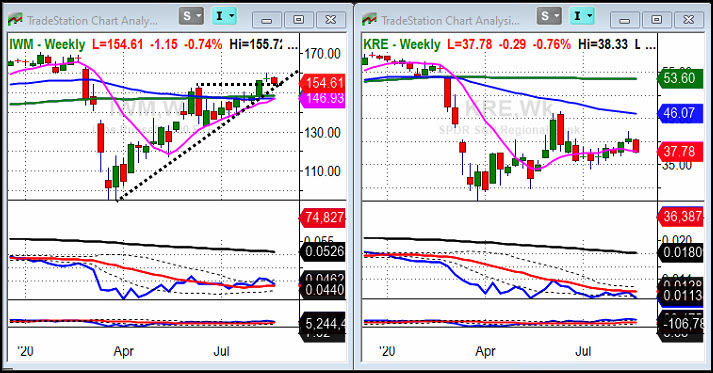
Lastly, as you can see in the chart above, retail banks, KRE, has not been doesn't appear to be able to help out the bull's cause.
So Grandpa Russell, IWM, will be left with a tough job to do if SMH rolls over.
As I began this article, IWM sits at good support created by the trendline from the March lows and the swing high on June 8 shown in the chart above.



Comments
Log in or sign up to join the conversation.