

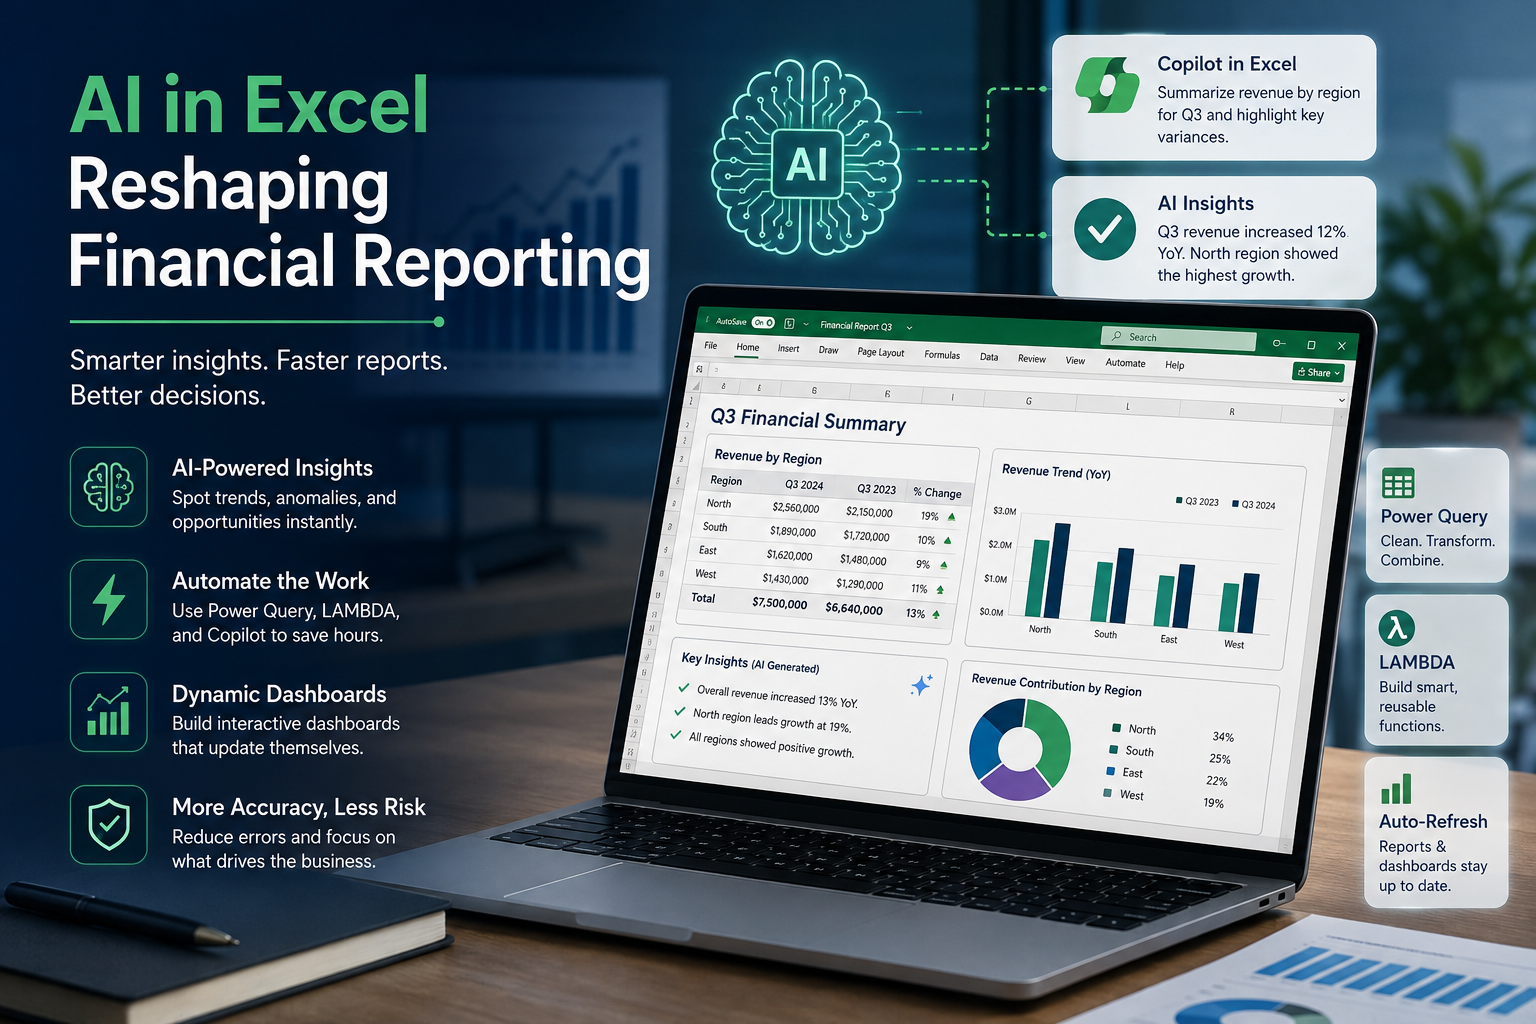
Financial reporting has always demanded precision, speed, and an uncomfortable amount of manual reconciliation. Spreadsheets get bigger, deadlines get tighter, and finance teams keep patching together formulas that break the moment a new data source is added. Artificial intelligence is finally changing that equation. With AI in Excel, finance professionals can generate reports, catch errors, and build dashboards in a fraction of the time it used to take, without abandoning the tool they already know.
This shift isn't about replacing accountants or analysts. It's about giving them a faster path from raw data to a report that's ready for leadership review.
Why Financial Reporting Needed an AI Upgrade
Traditional financial reporting workflows involve pulling data from multiple systems, cleaning it, building formulas, and formatting output so it's presentable. Each step is time-consuming, and each step is a place where errors creep in. A single mistyped cell reference can throw off an entire quarterly summary.
AI-powered features address these pain points directly. Instead of manually auditing thousands of rows, an analyst can ask Excel's AI assistant to identify anomalies, flag inconsistent formatting, or summarize trends across tabs. The result is a reporting process that's not just faster, but also more accurate.
Copilot as a Reporting Partner
Microsoft's Copilot for Excel has become the most visible entry point into AI-assisted reporting. It can interpret plain-language requests, such as "summarize revenue by region for Q3," and return a structured breakdown without the user writing a single formula. For financial reporting specifically, Copilot is useful for:
Drafting narrative summaries that accompany numerical data
Highlighting month-over-month or year-over-year variances
Suggesting chart types based on the underlying dataset
Cleaning up inconsistent labels before consolidation
Copilot doesn't eliminate the need for financial judgment. It shortens the distance between raw numbers and a report a CFO can actually use.
Automating the Heavy Lifting: Power Query and LAMBDA
Two features often get overlooked in conversations about AI in Excel, even though they form the backbone of automated reporting: Power Query and the LAMBDA function.
Power Query handles the unglamorous but essential work of pulling data from disparate sources, cleaning it, and loading it into a report-ready format. When paired with AI-assisted suggestions, Power Query can recommend transformation steps automatically, reducing the setup time for recurring monthly or quarterly reports.
LAMBDA, meanwhile, allows finance teams to build custom, reusable functions without writing VBA macros. Combined with the COPILOT worksheet function, LAMBDA lets analysts create intelligent, repeatable calculations that adapt as new data comes in. Together, these tools move financial reporting away from one-off manual builds and toward templates that update themselves.
Building Dashboards That Update Themselves
Dashboards are where AI in Excel earns its keep visually. Rather than manually rebuilding pivot tables and charts every reporting cycle, AI tools can now suggest layouts, auto-refresh visuals as source data changes, and even generate plain-language commentary explaining what a chart shows. For finance teams juggling multiple stakeholders, that means less time formatting slides and more time interpreting results.
AI vs. Traditional Pivot Tables
Pivot tables remain a staple of financial analysis, but AI features are starting to complement, not replace, them. Where a pivot table requires the user to know exactly which fields to drag and drop, AI assistants can suggest the most relevant groupings based on the question asked. This is particularly useful for less experienced analysts who understand the business question but aren't yet fluent in pivot table mechanics.
What Finance Teams Should Know Before Adopting AI Tools
Before rolling out AI-powered Excel features across a finance department, it's worth considering licensing requirements, data governance policies, and system compatibility. Not every AI feature is available on every Microsoft 365 plan, and sensitive financial data may require additional review before being processed by AI tools. Teams that plan ahead avoid disruption during a critical reporting cycle.
Professionals looking to build these skills in a structured setting can explore the 2026 AI-Powered Excel Masterclass, which covers Copilot, automation techniques, and practical financial reporting workflows.
Frequently Asked Questions
Q1.Does AI in Excel require a paid Microsoft 365 subscription?
Most advanced AI features, including Copilot, require specific Microsoft 365 plans. Availability varies, so it's worth checking current licensing details before planning a rollout.
Q2.Can AI tools in Excel replace manual financial review entirely?
No. AI can speed up data cleaning, summarization, and formatting, but financial judgment and final review still require human oversight, especially for compliance-sensitive reports.
Q3.Is Power Query considered an AI feature?
Power Query itself is a data transformation tool, but its AI-assisted suggestions for cleaning and shaping data are part of the broader AI in Excel toolkit.
Q4.How steep is the learning curve for LAMBDA and Copilot together?
Analysts already comfortable with formulas typically adapt quickly, since LAMBDA builds on existing function logic and Copilot uses plain-language prompts rather than new syntax.
Comments
Log in or sign up to join the conversation.