

Nowcasting the US Economy:
(Click on image to enlarge)
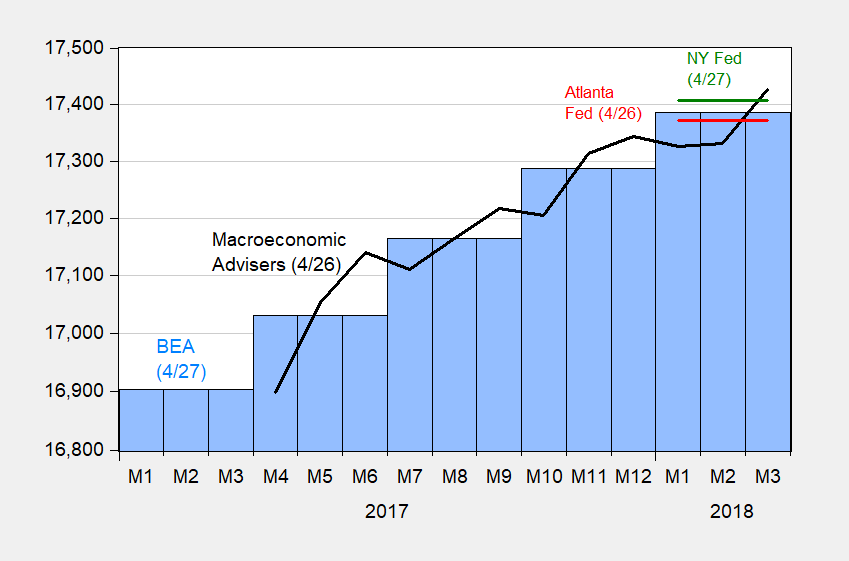
Figure 1: Reported GDP (blue bars), Atlanta Fed GDPNow (red), NY Fed nowcast (green), and Macroeconomic Advisers (black), all in billions Ch.2009$ SAAR, on log scale. Source: BEA 2018Q1 advance; Atlanta Fed (4/26), NY Fed (4/27), Macroeconomic Advisers (4/26).
See Jim’s recent post on the advance release.
Tracking GDP using GDO:
Furman (2016) notes the fact that GDO better predicts GDP than lagged GDP.
(Click on image to enlarge)
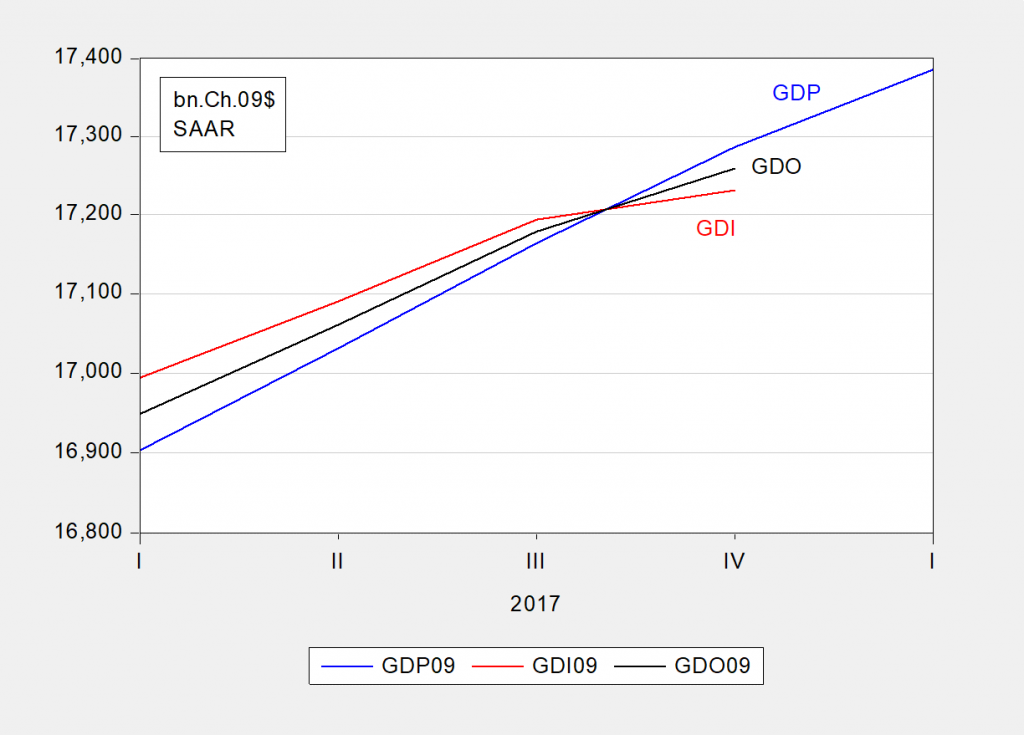
Figure 2: GDP (blue), GDI (red), GDO (green), as average of GDP and GDI, all in billions Ch.2009$ SAAR, on log scale. Source: BEA 2018Q1 advance.
The fact that GDO growth is lower than that of GDP is suggestive for what 2018Q1 will be revised to.
Conditional vs. Unconditional Forecasts:
(Click on image to enlarge)
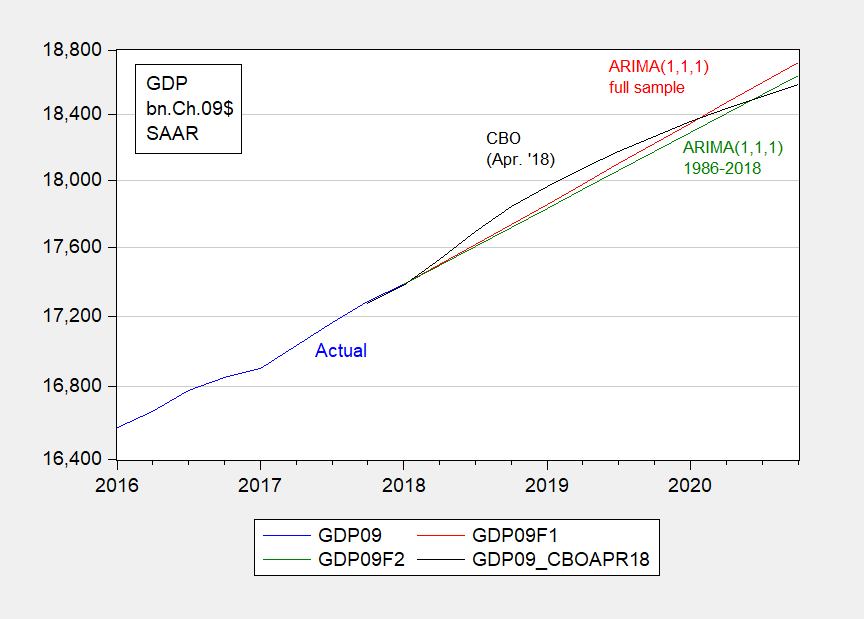
Figure 3: GDP (blue), ARIMA(1,1,1) dynamic forecast over 1967-2018Q1 (red), ARIMA(1,1,1) dynamic forecast over 1986-2018Q1 (green), CBO projection (black), all in billions Ch.2009$ SAAR, on log scale. Source: BEA 2018Q1 advance, CBO Budget and Economic Outlook (April 2018), and author’s calculations.
CBO conditions on the Tax Cut and Jobs Act (TCJA) and new budget, so the trajectory of output is higher — for the most part — than dynamic forecasts from simple time series models that are unconditional. Obviously, with slower growth in era of the Great Moderation, the ARIMA model estimated from the post-1986 period implies a lower path.
Which One of These Is Not Like the Others?
(Click on image to enlarge)
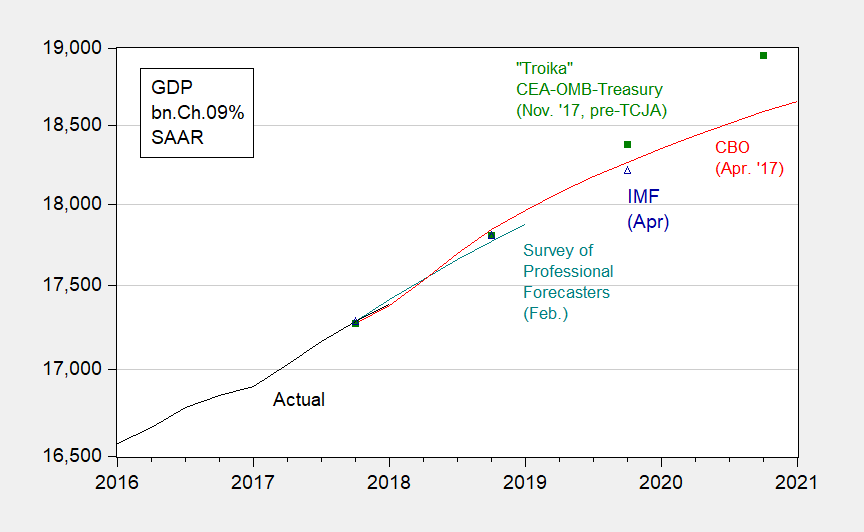
Figure 4: GDP (black), CBO projection (red), Survey of Professional Forecasters median from February (teal), CEA-OMB-Treasury (green squares), IMF World Economic Outlook(dark blue open triangle), all in billions Ch.2009$ SAAR, on log scale. Source: BEA 2018Q1 advance, CBO Budget and Economic Outlook (April 2018), Philadelphia Fed Survey of Professional Forecasters, IMF World Economic Oultook, and author’s calculations.
All the conditional forecasts match up over the short term. Starting by the end of 2019, the Administration estimate (by the Troika of CEA, OMB, and Treasury) starts to peel away from the others. Why this occurs can be traced back in part to differential assumptions regarding productivity growth. If you want to consider the plausibility of the Admninistration view, one might want to consider that the Troika forecast does not incorporate the massive tax cuts and relaxed spending constraints.
No Recession Right Now. Probably.
The NBER Business Cycle Dating Committee (BCDC) has in the past paid special attention to four key macro indicators, as well as the Macroeconomic Advisers’ monthly GDP series. Figure 6 displays these five variables, normalized on the recent peak in industrial production.
(Click on image to enlarge)
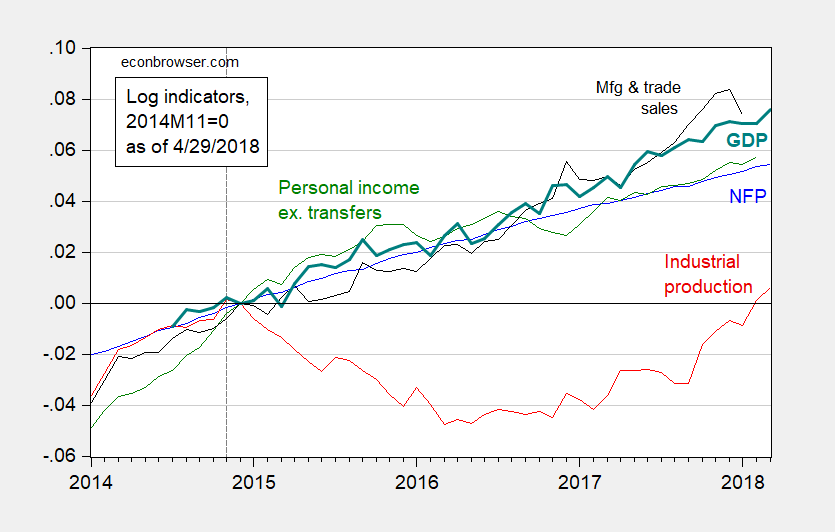
Figure 5: Log nonfarm payroll employment (blue), industrial production (red), real personal income excluding current transfers (green), real manufacturing and trade sales (black), real GDP (bold teal), all normalized to 2014M11=0. Source: FRED, Macroeconomic Advisers, and author’s calculations.
With most of the indicators rising (manufacturing and trade sales is the only declining at last report), an ongoing recession is unlikely. However, one should never “pull and Ed Lazear” and declare no recession.
The Yield Curve Predicts…
(Click on image to enlarge)
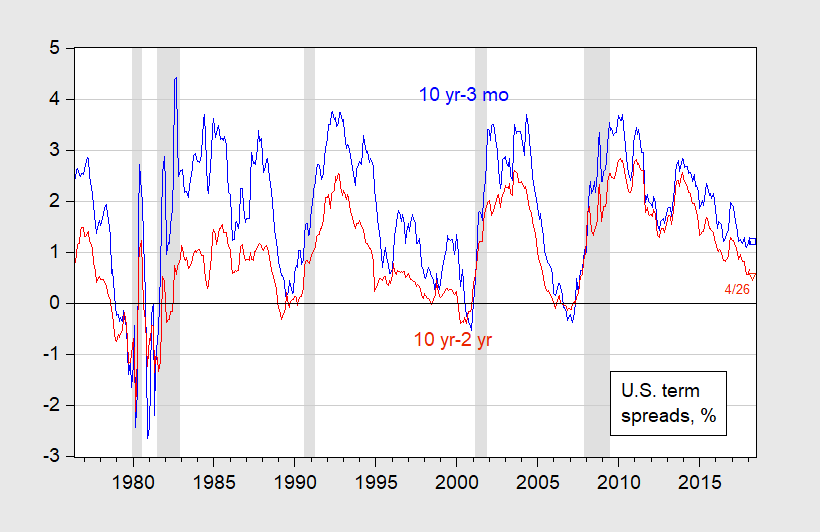
Figure 6: Ten year constant maturity minus three month T-bills in secondary market spread (blue), Ten year minus two year constant maturity spread (red). April observations for 4/26. NBER defined recession dates shaded gray. Source: Federal Reserve via FRED, and author’s calculations.
A simple term spread regression implies roughly 15% probability of a recession in 6 months (see Chinn and Kucko, 2015). More on spread models in this March SF Fed Economic Letter, Econofact.



Comments
Log in or sign up to join the conversation.