


Silver (XAGUSD) has recently moved lower as part of the corrective cycle that started from the August high at 71.20. The current price action is giving us an interesting Elliott Wave structure, which we will examine in this analysis.
Before looking at the current market setup, let’s briefly review the Elliott Wave Zig Zag pattern and how it can help us identify potential areas where a correction may reach completion.
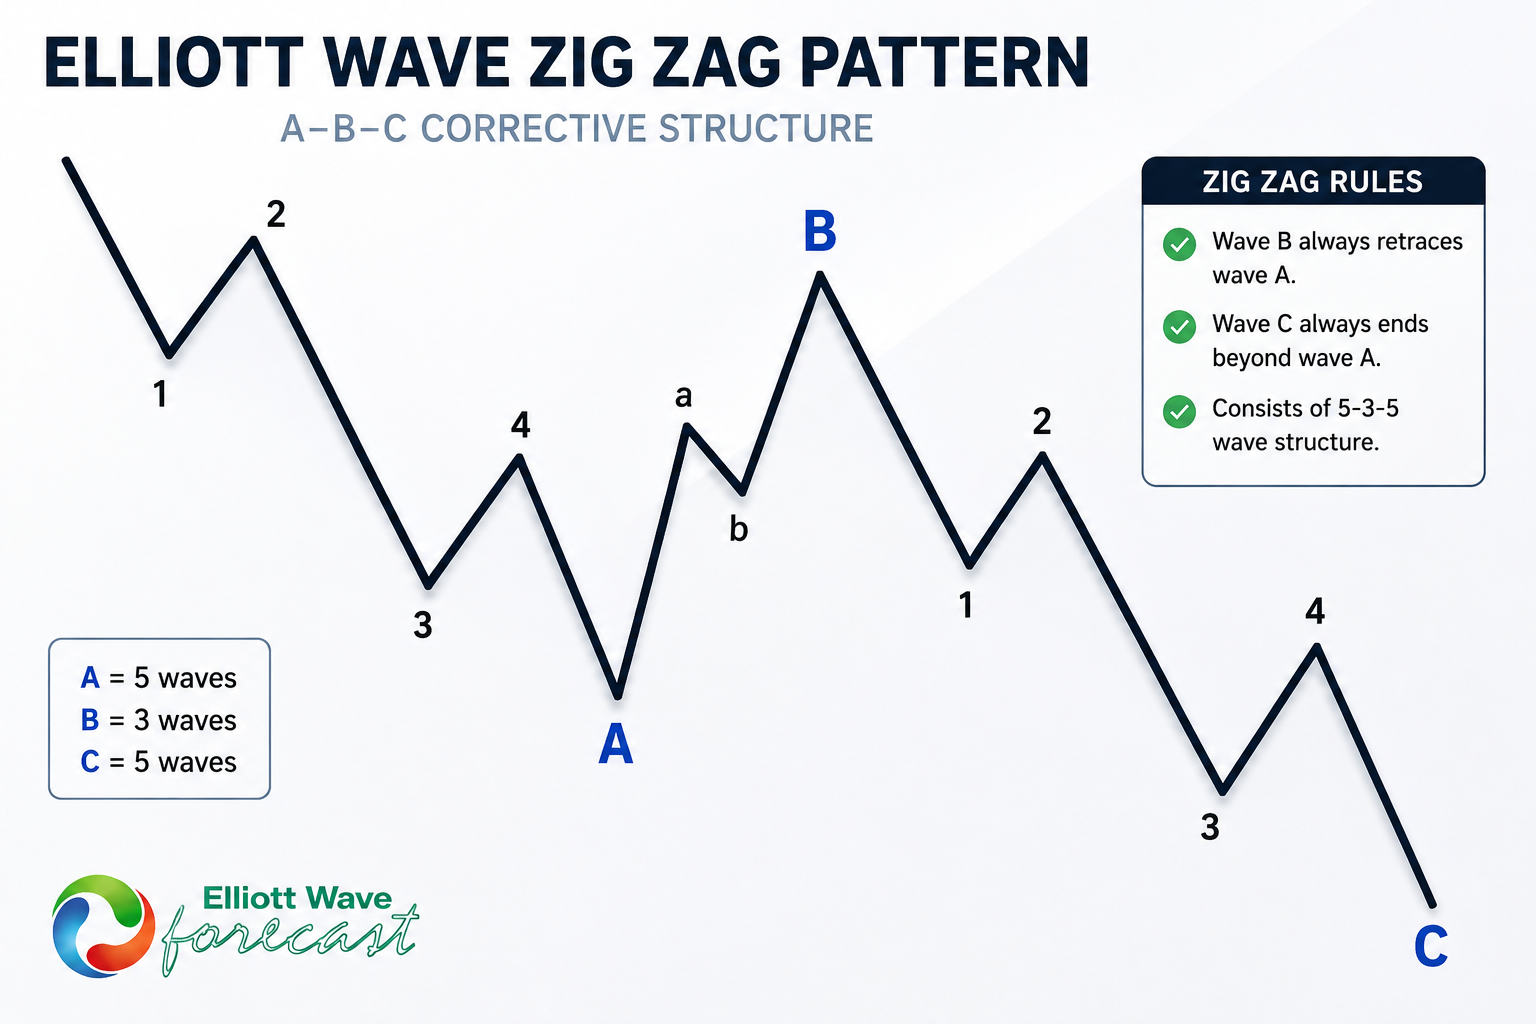
Elliott Wave Zigzag is the most popular corrective pattern in Elliott Wave theory . It’s made of 3 swings which have 5-3-5 inner structure. Inner swings are A,B,C where A =5 waves, B=3 waves and C=5 waves. That means A and C can be either impulsive waves or diagonals. (Leading Diagonal in case of wave A or Ending in case of wave C) . Waves A and C must meet all conditions of being 5 wave structure, such as: having RSI divergency between wave subdivisions, ideal Fibonacci extensions and ideal retracements.
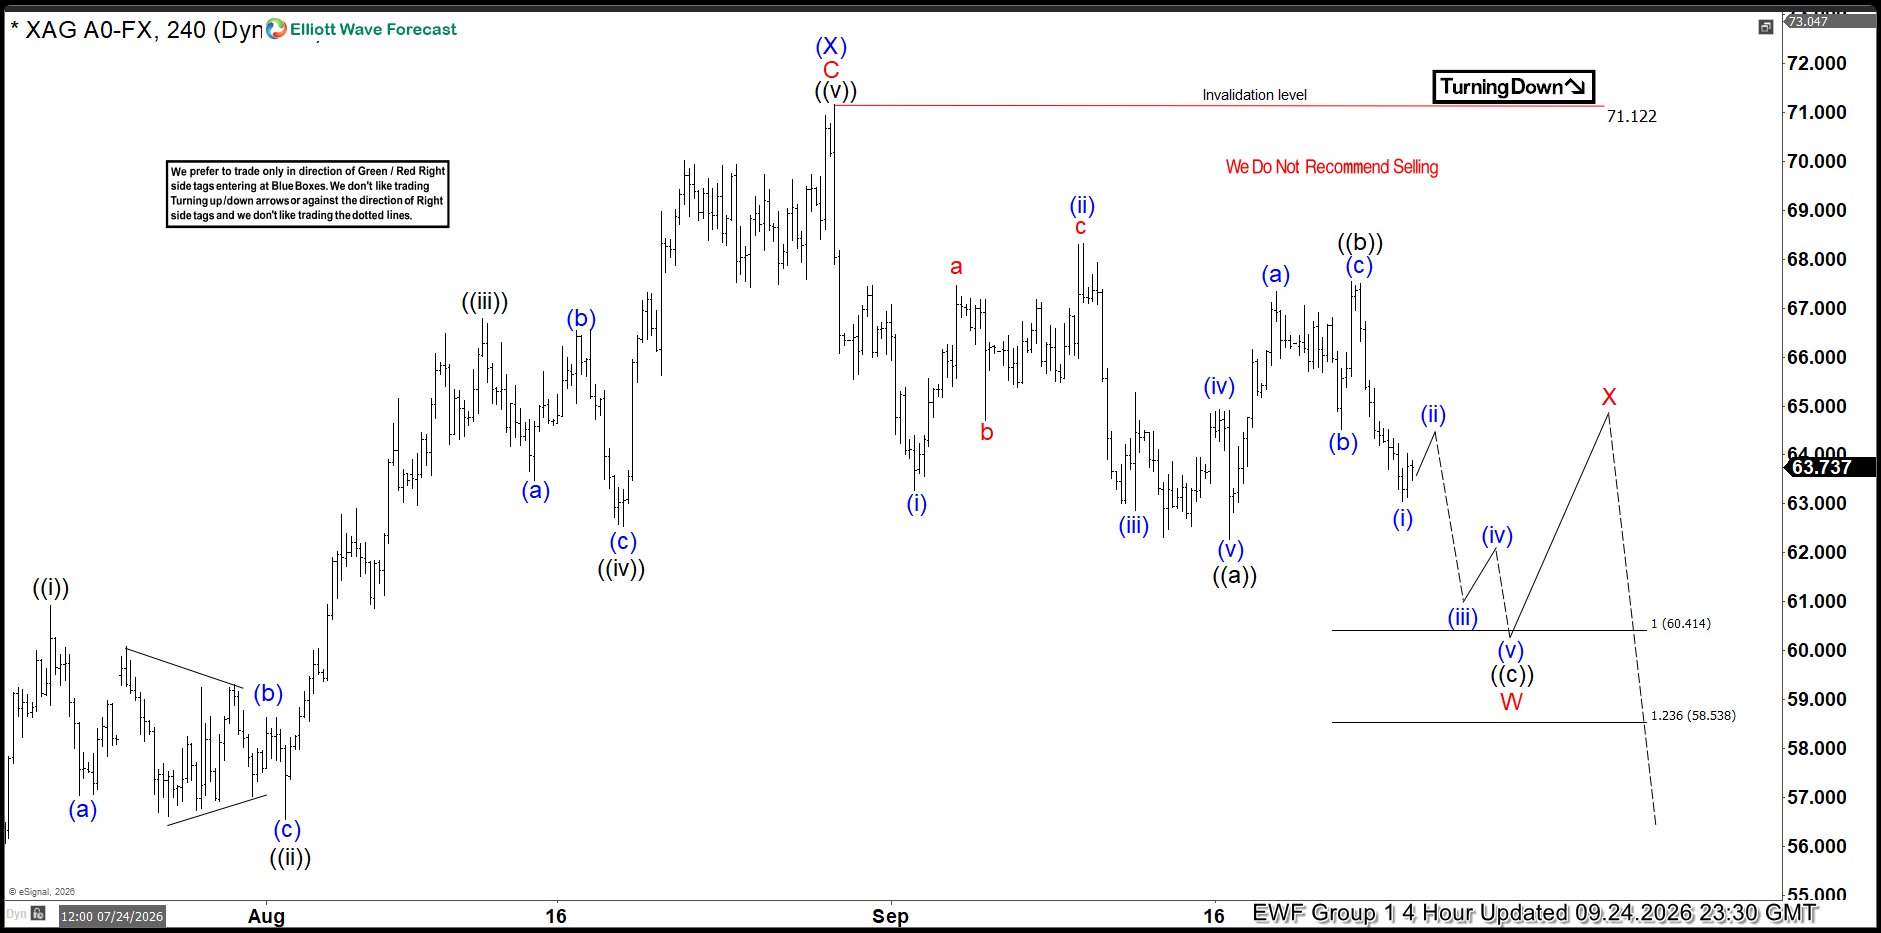
XAGUSD Elliott Wave 4 Hour Chart 09.24.2026
Silver is showing a corrective cycle from the August 28 peak, with the price action currently developing as an Elliott Wave Zig Zag pattern. The initial decline from the peak unfolded in five waves, forming wave ((a)), followed by a three-wave corrective bounce in wave ((b)). This structure supports the view that the cycle is taking the form of an Elliott Wave Zig Zag pattern, which is not yet complete.
Our preferred count suggests that Silver is now developing the final wave ((c)) lower. If the structure continues as expected, wave ((c)) should unfold in five waves and eventually reach the Equal Legs area at 60.41–58.53, where the correction could potentially find support.
Official trading strategy on How to trade 3, 7, or 11 swing and equal leg is explained in details in Educational Video, available for members viewing inside the membership area.
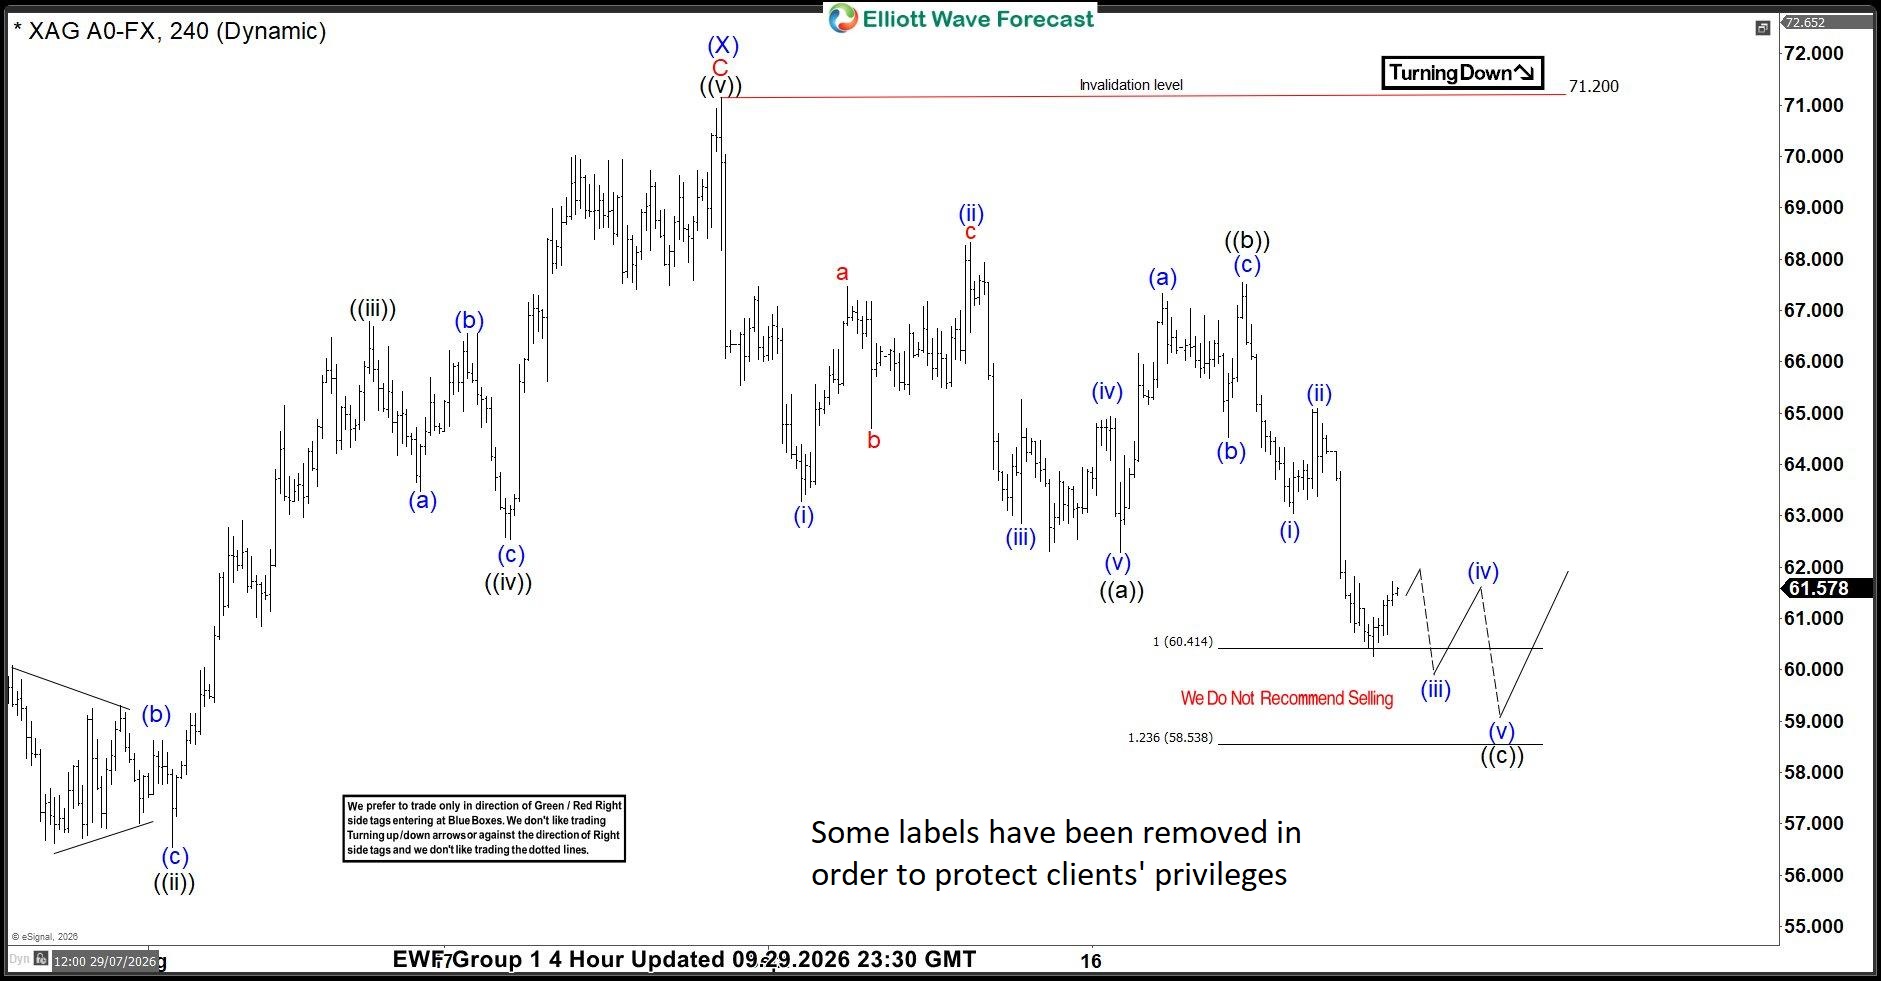
XAGUSD Elliott Wave 4 Hour Chart 09.29.2026
Silver declined as expected and reached the extreme zone at 60.41–58.53. The commodity has already produced a short-term bounce from the Equal Legs area. However, so far, we can only count three waves within the ((c)) leg, suggesting that the cycle remains incomplete. The preferred view still suggests that the cycle is unfolding as an Elliott Wave Zig Zag pattern. Therefore, we could potentially see at least one more low to complete the five-wave structure within the ((c)) leg.
For now, we will continue to monitor the internal structure and the reaction from the current area.
Keep in mind that the market is dynamic, and the outlook may have changed in the meantime. Our member Chat Rooms are open 24 hours a day, Monday through Friday, on trading days, providing ongoing expert guidance on market trends and Elliott Wave analysis. Members can ask questions about market structure and technical setups at any time during trading days.



Comments
Log in or sign up to join the conversation.