

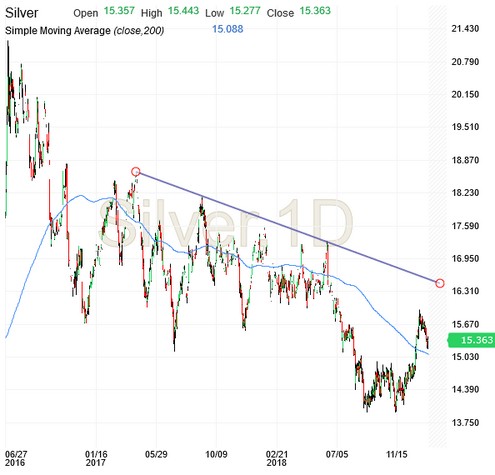
Let’s focus on a longer-term view of the daily candles. The overhead resistance shows that the market is still on a downtrend (and thus the recent bounce from the 14s can be considered a corrective move), but the 200-DSMA (below the market) can work as a good support level even for more long-term oriented positions.
(Click on image to enlarge)
source: investing.com


Comments
Log in or sign up to join the conversation.