

Silver prices (XAG/USD) collapsed for the first time in the week, down nearly 5% sponsored by steady US Treasury yields and a firm US Dollar, which weighed on the white metal. At the time of writing, XAG/USD trades at $73.49 after peaking at $76.87.
XAG/USD Price Forecast: Technical outlook
The technical picture shows Silver is neutral biased but tilted to the downside. Price action shows a successive series of lower highs, along with hitting a six-day low at $72.00, which once decisively surpassed, clears the door to test $70.00.
The Relative Strength Index (RSI) slope is downwards, along with remaining at bearish territory, hints that XAG/USD could continue its path towards testing the 100-day Simple Moving Average (SMA) at $64.71.
On further weakness, the next support would be the $60.00 milestone.
Conversely, if XAG/USD reclaims $75.00, buyers could remain hopeful of challenging the 50-day SMA at $79.39. A breach of the latter will expose $80.00.
XAG/USD Price Chart — Daily
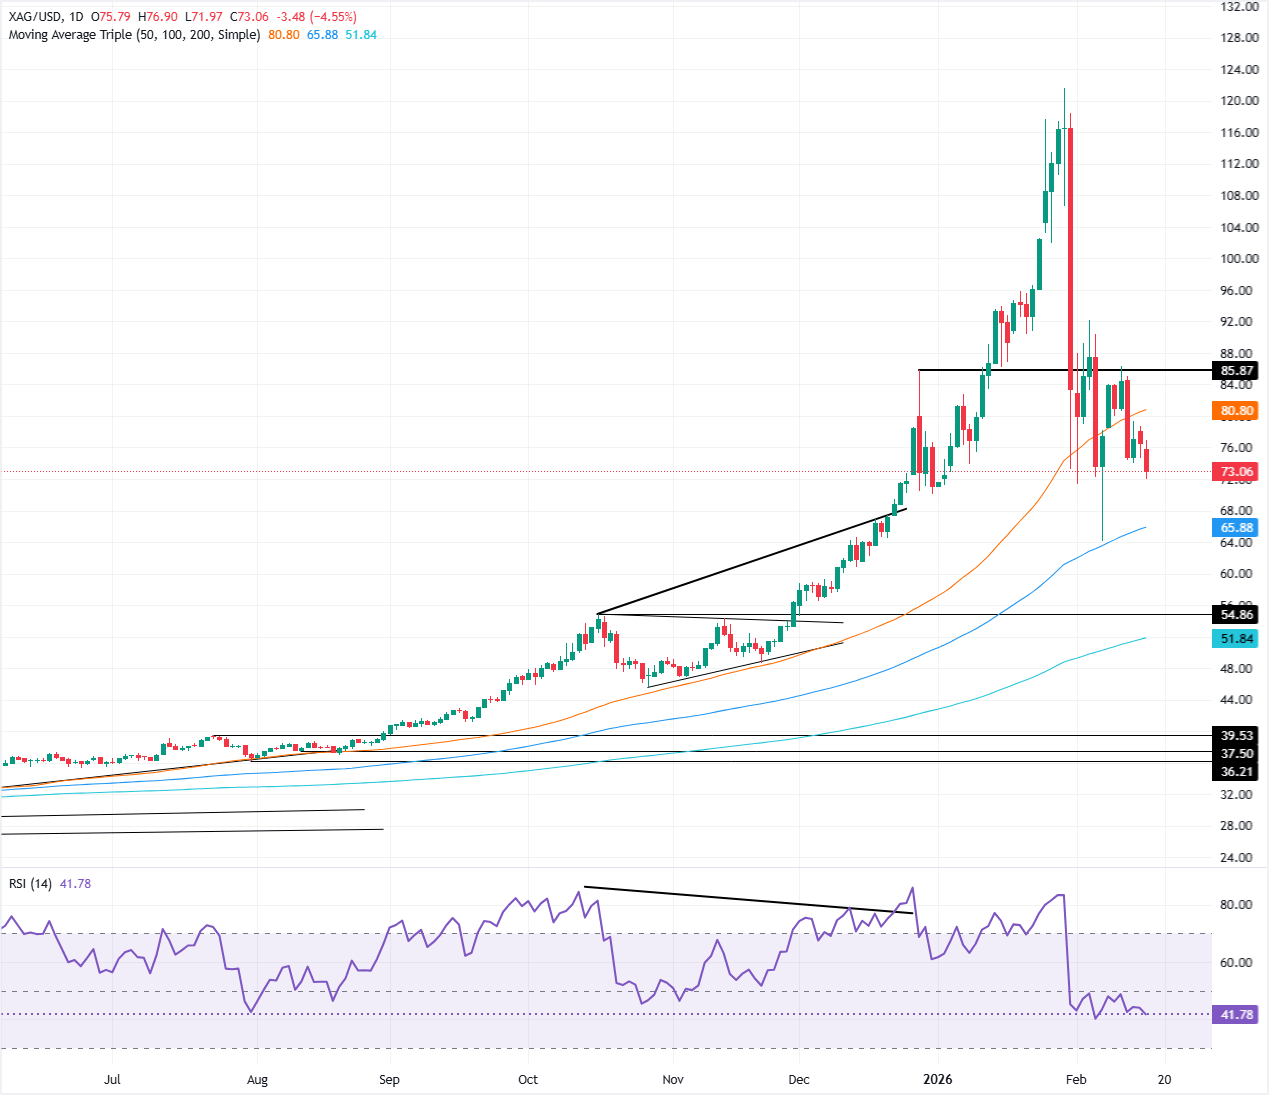
Silver Daily Chart

Comments
Log in or sign up to join the conversation.