


Silver (XAG/USD) edges higher on Friday as a pullback in Oil prices pushes US Treasury yields lower, while the US Dollar (USD) fluctuates near recent highs. At the time of writing, XAG/USD trades around $58.60, up 2.40% on the day.
Despite the pullback, Oil prices and US Treasury yields remain elevated, keeping Silver's upside in check as persistent inflation concerns reinforce hawkish Federal Reserve (Fed) expectations.
Higher borrowing costs typically weigh on non-yielding assets such as Silver. According to the CME FedWatch Tool, traders see an 80% chance of a rate hike in September, although the Fed is widely expected to leave interest rates unchanged at next week’s meeting.
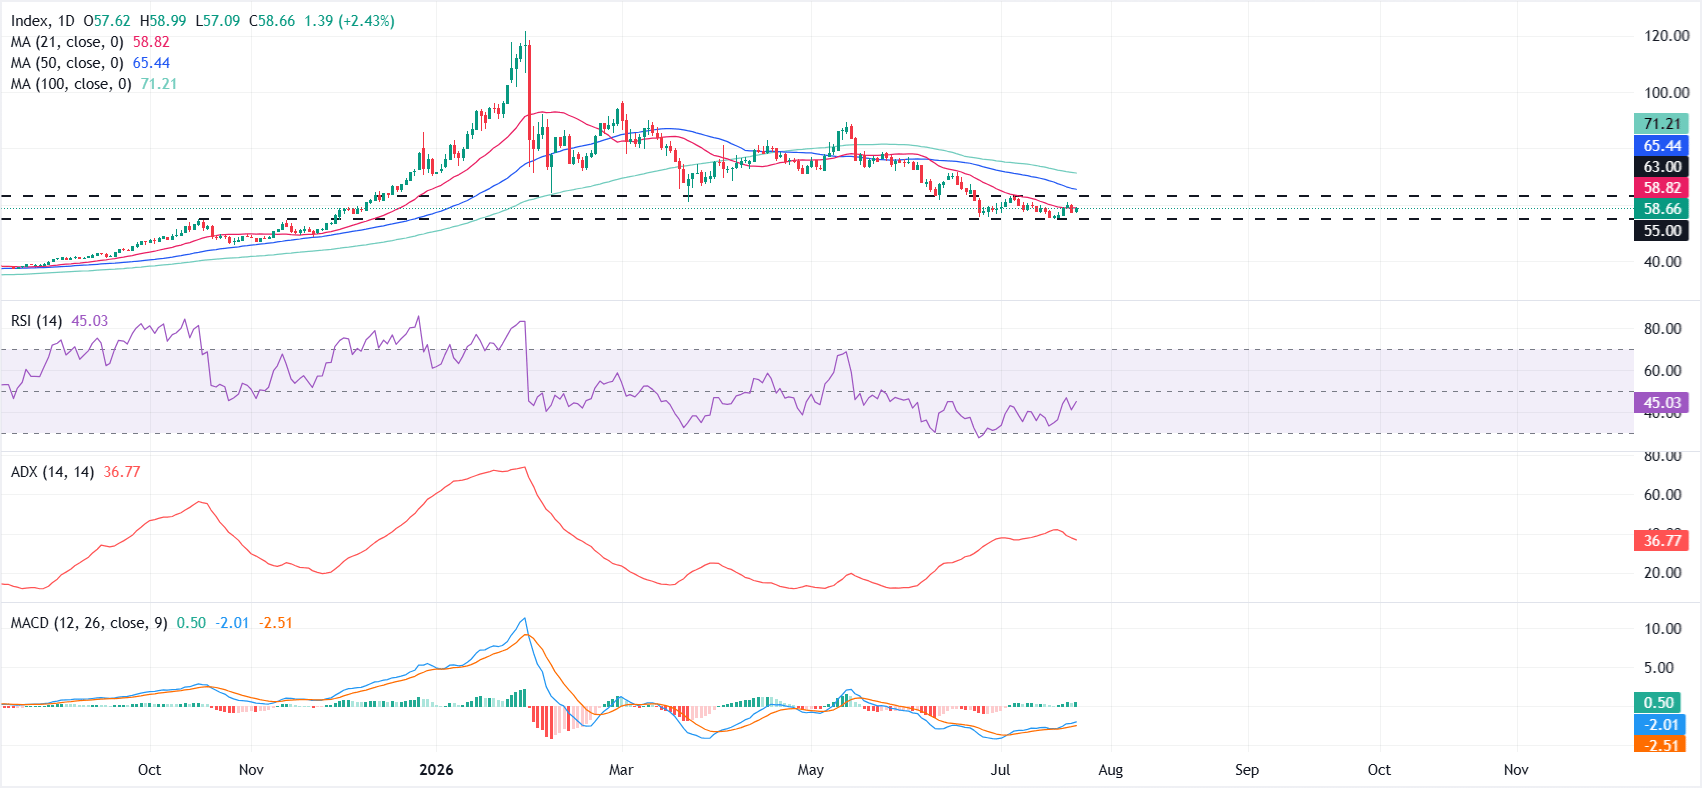
From a technical perspective, Silver has traded between $55 and $63 since late June, pointing to signs of stabilization following a series of lower highs and lower lows from May’s peak near $90.00.
However, XAG/USD is struggling around the 21-day Simple Moving Average (SMA) at $58.82, while the 50-day and 100-day SMAs at $65.44 and $71.21, respectively, keep the broader bearish structure intact.
Momentum indicators paint a mixed picture. The Relative Strength Index (RSI) near 45 points to subdued momentum, while the Moving Average Convergence Divergence (MACD) indicator sits slightly above the zero line, indicating moderate selling pressure. Meanwhile, the Average Directional Index (ADX) near 36 indicates that the broader trend retains meaningful strength.
On the downside, initial support is seen at the horizontal floor near $55, where buyers previously stepped in. On the topside, bulls need to reclaim the 21-day SMA at $58.82 to ease immediate downside pressure. Further resistance is located at $63 and the 50-day SMA at $65.44.
Only a sustained break above these barriers would begin to challenge the broader bearish structure, with the 100-day SMA at $71.21 acting as the next major hurdle.



Comments
Log in or sign up to join the conversation.