

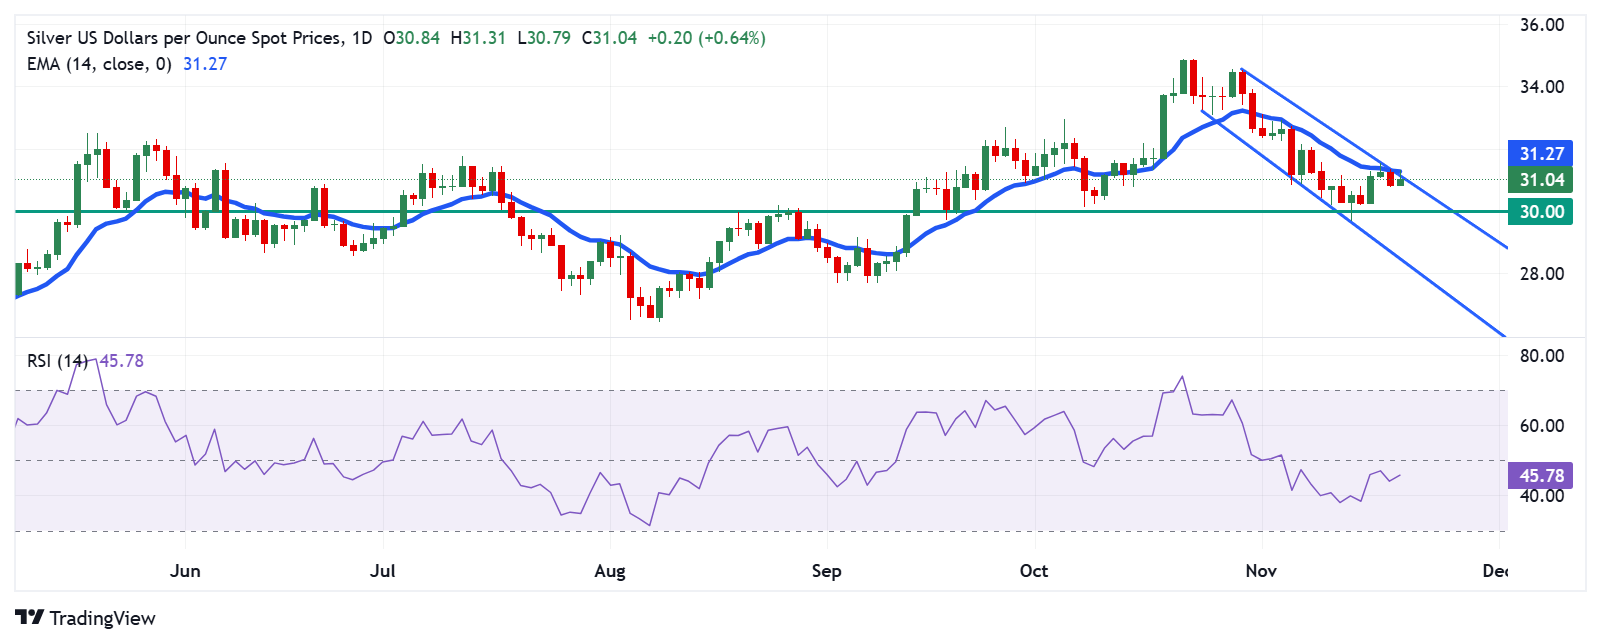
Silver price (XAG/USD) appreciates to near $31.10 per troy ounce during the European hours on Thursday. The daily chart analysis suggests a possible shift in momentum from bearish to bullish as the pair attempts to break above the upper boundary of the descending channel pattern.
Furthermore, the 14-day Relative Strength Index (RSI) is currently positioned just below the 50 level, indicating the potential for a momentum reversal. A decisive break above the 50 mark would confirm the development of a bullish bias.
In terms of the upside, the Silver price tests a key resistance zone near the upper boundary of the descending channel, which aligns with the 14-day Exponential Moving Average (EMA) at $31.27. A decisive break above this region could trigger the bullish bias, paving the way for a move toward the psychological resistance of $32.00.
On the downside, the Silver price may find support around its “throwback support” at the psychological level of $30.00. A break below this level could deepen bearish sentiment, potentially driving the price lower toward the descending channel's bottom boundary at $28.50.
XAG/USD: Daily Chart
(Click on image to enlarge)
More By This Author:
Australian Dollar Holds Steady After The Release Of The RBA Meeting MinutesAustralian Dollar Continues To Face Downward Pressure Following China Key Data
GBP/JPY Remains Tepid Around 197.50, Awaits BoE Bailey Speech
Comments
Log in or sign up to join the conversation.