


Silver price advanced by some 0.39% on Friday, capped by rising US yields, even though US data was softer than expected. XAG/USD trades at $64.70, after bouncing off daily lows of $63.51.
XAG/USD Price Forecast: Technical Outlook
The white metal remains downward biased despite signs of bottoming around the $54.70 area, near the yearly low of $54.77. Momentum is bullish in the short term, as indicated by the Relative Strength Index (RSI), but from a market structure perspective, it remains bearish.
For a bullish continuation, the first resistance for XAG/USD would be the 100-day Simple Moving Average (SMA) at $68.76. Above, the first key resistance is the 200-day SMA at 71.64, ahead of the $72.00 mark
On the downside, if Silver drops the July 6 high of $63.28, the next support would be the 50-day SMA at $61.35. Below the next stop would be the August 3 low of $56.57, followed by the yearly low of $54.77.
XAG/USD Price Chart – Daily
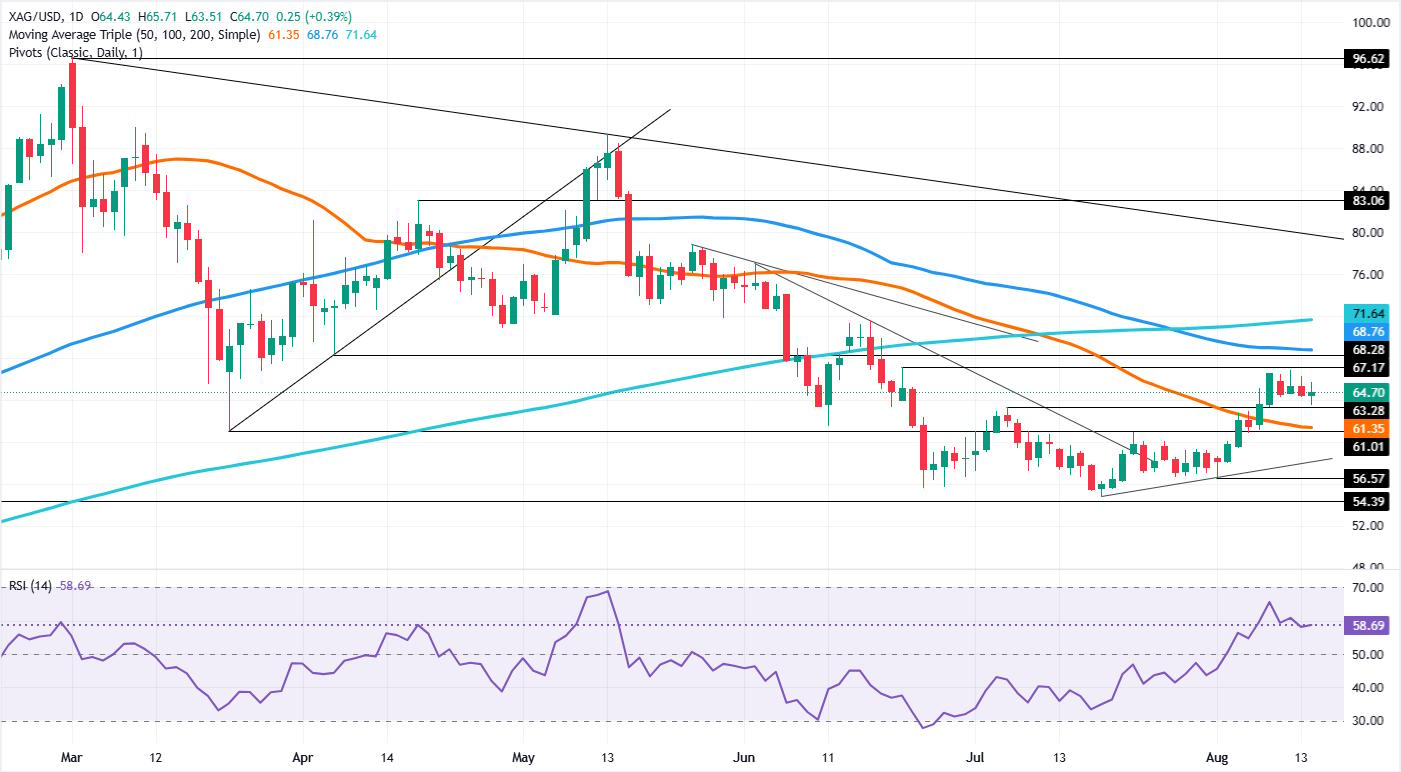
Silver daily chart


Comments
Log in or sign up to join the conversation.