

Silver holds modest gains as the US Dollar and Treasury yields stabilise following last week's decline.
The technical outlook remains bearish as XAG/USD trades within a descending channel below key daily SMAs.
The $55 level provides key support, while $60 acts as immediate resistance.

Silver (XAG/USD) kicks off the week on a bullish note but struggles to extend its gains as the US Dollar (USD) and US Treasury yields pause their decline following last week’s correction from recent highs. Expectations that the Federal Reserve (Fed) could deliver another interest rate hike before year-end also contain the upside for the non-yielding metal. At the time of writing, XAG/USD trades around $57.65, up nearly 1.15% on the day.
The US Dollar Index (DXY), which tracks the Greenback’s value against a basket of six major currencies, trades around 101.95 after falling to 101.58 last week. Meanwhile, the benchmark 10-year US Treasury yield stands near 5.09%, recovering from Thursday’s low of 5.03%.
Technical analysis
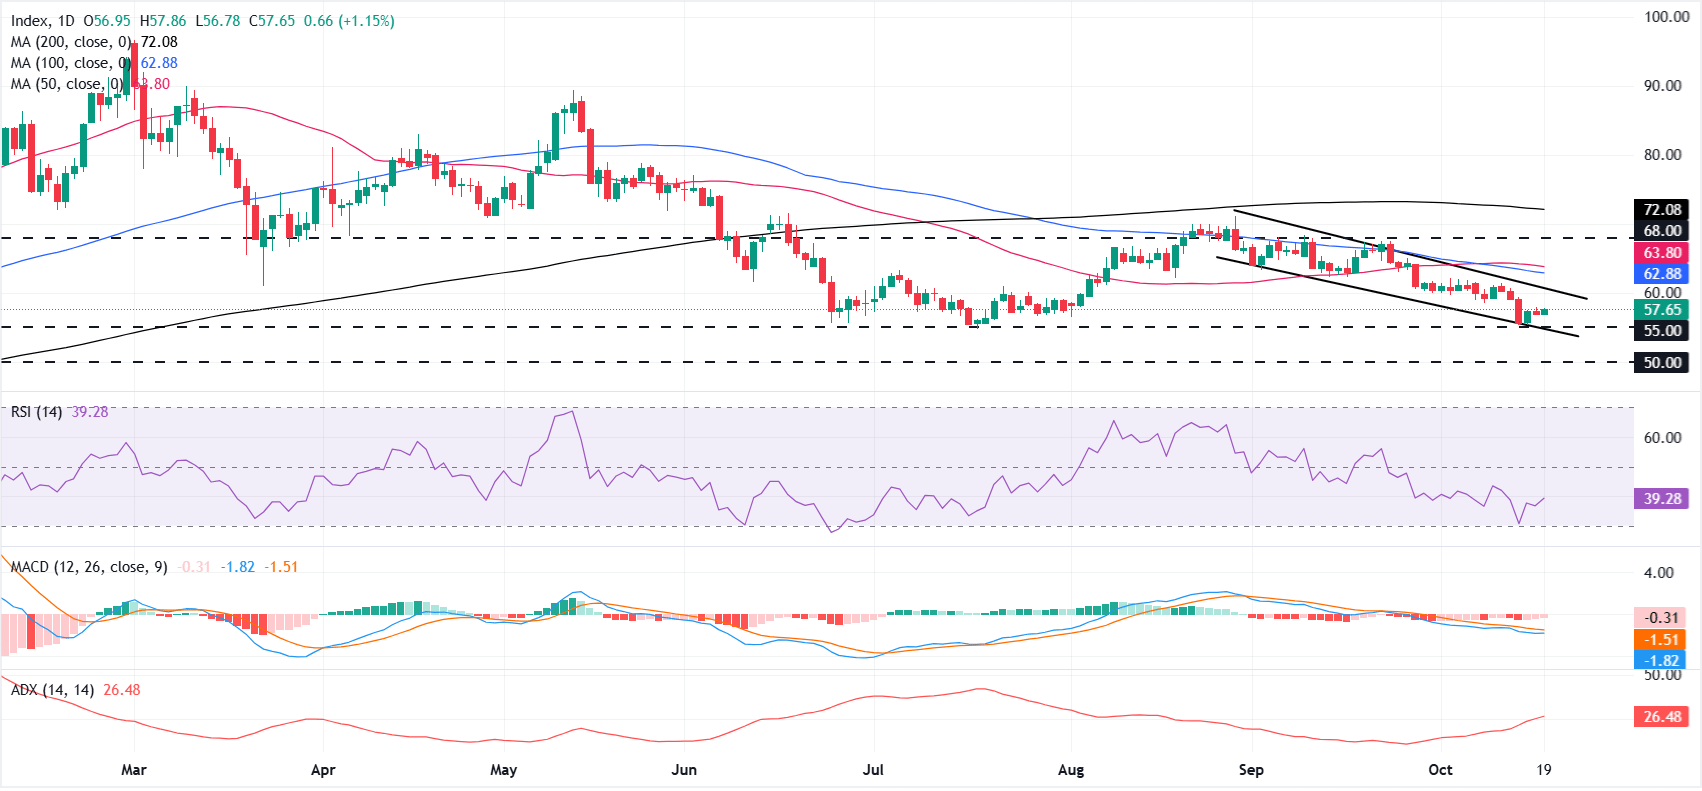
From a technical perspective, Silver maintains a bearish structure within a descending parallel channel, forming a series of lower highs and lower lows since peaking near $71 in late August. The metal also trades below its key daily Simple Moving Averages (SMAs).
Momentum indicators remain bearish. The Relative Strength Index (RSI) near 39 and a negative Moving Average Convergence Divergence (MACD) reading reinforce prevailing downside pressure within a strengthening trend backdrop indicated by the Average Directional Index (ADX) above 26.
On the downside, the $55 psychological mark provides strong initial support, as buyers previously stepped in around this level. This area also aligns with the lower boundary of the descending channel. A decisive break below $55 could expose the $50 psychological level.
On the topside, initial resistance appears at the $60 psychological mark, followed by the 100-day SMA at $62.88 and the 50-day SMA at $63.80. Further gains could open the door toward the $68-$70 resistance zone, while the 200-day SMA near $72.08 remains the main longer-term barrier.



Comments
Log in or sign up to join the conversation.