

Silver (XAG/USD) is trading in a familiar range so far this Wednesday, defending the $24 mark while the bears look to extend control in the near-term.
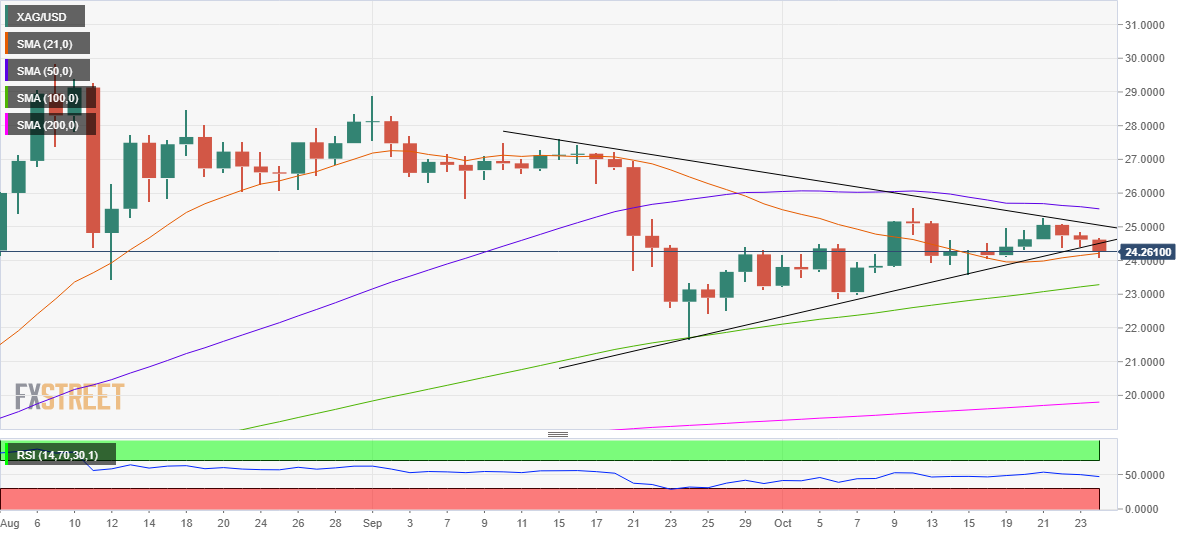
The spot is clinging onto the 21-daily moving average (DMA) at $24.25, awaiting a fresh catalyst to resume the move lower.
It's worth noting that the price charted a symmetrical triangle breakdown on the daily chart last Monday, having closed the day below the rising trendline (pattern) support, then at $24.51.
On a fresh selling wave, the white metal is likely to test the 100-DMA support at $23.41. A break below the latter could expose the September 24 low of $21.65.
The daily Relative Strength Index (RSI) inches lower, below the midline, at 46.81, pointing towards the additional downside.
To the upside, the pattern support-turned-resistance, now at $24.76, needs to be scaled, in order to trigger a pullback towards the $25 mark.
XAG/USD: Daily chart
(Click on image to enlarge)
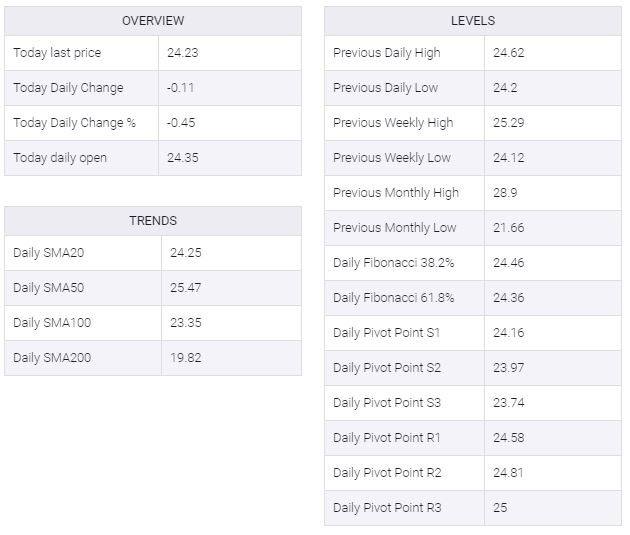
XAG/USD: Additional levels
XAG/USD



Comments
Log in or sign up to join the conversation.