


Image Source: Pixabay
- Silver regains positive traction on Thursday, albeit lacks follow-through buying.
- The mixed technical setup warrants caution before placing any directional bets.
- A sustained strength beyond $23.00 should pave the way for additional gains.
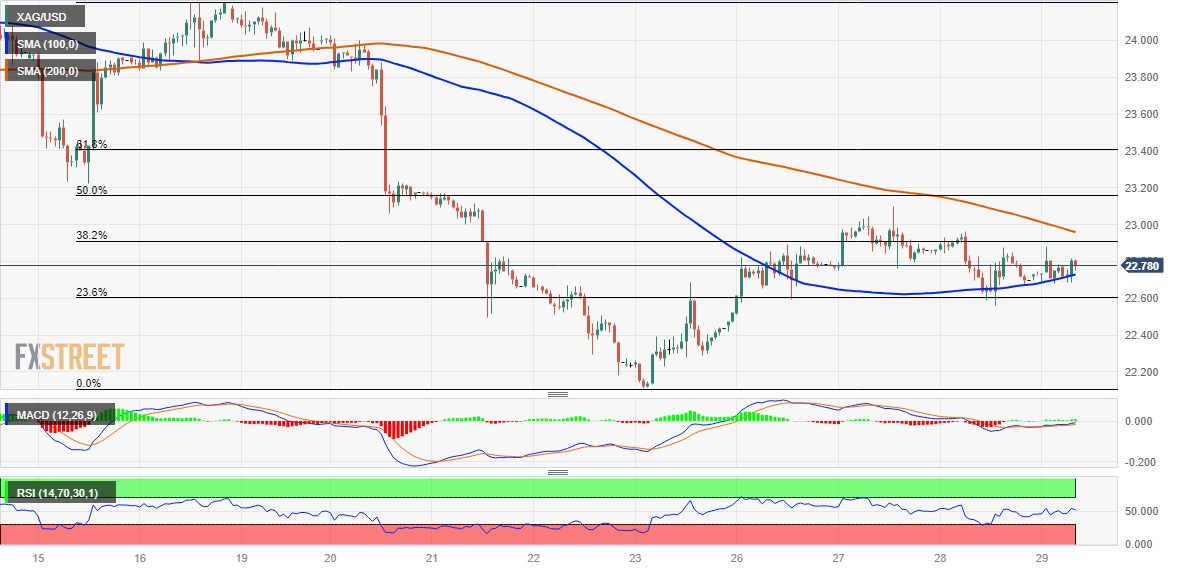
Silver attracts some buyers near the 100-hour Simple Moving Average (SMA) on Thursday and reverses a major part of its losses recorded the previous day; The white metal, however, struggles to make it through the 38.2% Fibonacci retracement level of the last week's downfall and trades around the $22.75-$22.80 region, up over 0.40% for the day during the first half of the European session.
From a technical perspective, the XAG/USD this week struggles to find acceptance above the $23.00 mark and faced rejection just ahead of the 50% Fibo. level. The subsequent downfall, however, stalls near the $22.55 confluence, comprising the 100-hour SMA and the 23.6% Fibo. level. The said areas should now act as a pivotal point, which if broken decisively will be seen as a fresh trigger for bearish traders. The XAG/USD might slide back to retest the multi-month low, around the $22.10 region touched last week.
Some follow-through selling below the $22.00 mark should pave the way for deeper losses and accelerate the fall further toward the $21.70-$21.65 zone. The downward trajectory could get extended further towards the next relevant support near the $21.25 region before the XAG/USD eventually drops to the $21.00 round figure.
On the flip side, any further intraday move up might continue to confront stiff resistance near the $23.00 mark, or 200-hour SMA. This is closely followed by 50% Fibo., around the $23.15 region, and the $23.40 area, or 61.8% Fibo. A convincing breakthrough the latter will confirm that the XAG/USD has formed a near-term bottom just ahead of the $22.00 mark and trigger a fresh bout of a short-covering rally. This should pave the for some meaningful appreciating move and lift the white metal to the $23.65-$23.70 hurdle.
Silver 1-hour chart
(Click on image to enlarge)
Key levels to watch
XAG/USD
| OVERVIEW | |
|---|---|
| Today last price | 22.79 |
| Today Daily Change | 0.09 |
| Today Daily Change % | 0.40 |
| Today daily open | 22.7 |
| TRENDS | |
|---|---|
| Daily SMA20 | 23.46 |
| Daily SMA50 | 24.04 |
| Daily SMA100 | 23.34 |
| Daily SMA200 | 22.54 |
| LEVELS | |
|---|---|
| Previous Daily High | 22.96 |
| Previous Daily Low | 22.56 |
| Previous Weekly High | 24.2 |
| Previous Weekly Low | 22.11 |
| Previous Monthly High | 26.14 |
| Previous Monthly Low | 22.68 |
| Daily Fibonacci 38.2% | 22.72 |
| Daily Fibonacci 61.8% | 22.81 |
| Daily Pivot Point S1 | 22.52 |
| Daily Pivot Point S2 | 22.34 |
| Daily Pivot Point S3 | 22.12 |
| Daily Pivot Point R1 | 22.92 |
| Daily Pivot Point R2 | 23.14 |
| Daily Pivot Point R3 | 23.32 |
More By This Author:
USD/JPY Whipsaws At Multi-Month High Below 145.00 On Fed Chair Powell SpeechEUR/USD Dives On Speculations For Additional Hikes After Fed Chair Powell Remarks
Pound Sterling Remains Capped Below 1.2800 As More Interest Rate Hikes Could Dampen UK Economy


Comments
Log in or sign up to join the conversation.