

Silver staged a goodish intraday bounce from the $24.75 area, or the lowest level since April 13 touched earlier this Wednesday. The commodity held on to its recovery gains through the mid-European session, albeit retreated a bit from daily tops and was last seen trading just above the key $25.00 psychological mark.

Image Source: Pixabay
Extremely oversold RSI on hourly charts turned out to be a key factor that prompted some short-covering move and assisted the XAG/USD to snap three consecutive days of the losing streak. That said, the near-term bias remains tilted firmly in favour of bearish traders and supports prospects for a further depreciating move.
The XAG/USD this week confirmed a bearish break through the $25.70-65 confluence support – comprising of the very important 200-day SMA and the 61.8% Fibonacci level of the $23.78-$28.75 move up. Some follow-through weakness below the previous monthly swing lows, around mid-$25.00s, and the $25.00 mark added credence to the negative outlook.
That said, the emergence of some dip-buying just ahead of the $24.70-65 intermediate support warrants some caution for aggressive bearish traders. Nevertheless, the XAG/USD still seems vulnerable to extend the downward trajectory towards the $24.00 round-figure mark before eventually dropping to challenge YTD lows, around the $23.80-75 region.
On the flip side, any meaningful recovery attempt could be seen as a selling opportunity and runs the risk of fizzling out rather quickly near the mentioned $25.70-65 confluence support breakpoint. This is followed by the $26.00 round-figure mark, above which the recovery could get extended towards the next relevant barrier near the $26.40-50 heavy supply zone.
Silver daily chart
(Click on image to enlarge)
-637624661338305651.png)
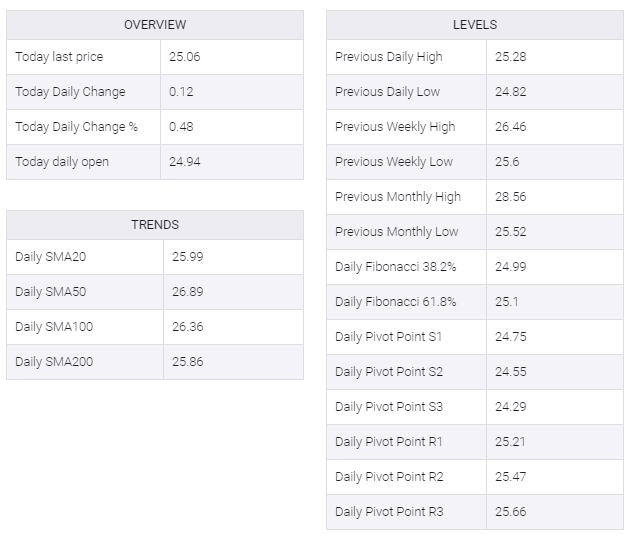
Technical levels to watch
XAG/USD

Comments
Log in or sign up to join the conversation.