
Most of the people were quite amazed about the adventurous motions in Silver. And if there is some hype about a market for whatsoever great or bad reason I absolutely like to do the freaking opposite of the majorities’ opinion. Well, for a particular time. This time shorting Silver made sense. And as soon as the experts have shared their thoughts about a major pullback it was the moment in which I have bought the lovely Silver. That said, I’ve thought to provide you with some of my current observations for this market.
This week I’ve figured out that it’s a nice idea to look at some huge macro charts. Macro charts with Yearly bars and 100 Years of data. You know, if the daily timeframe seem to going vertical out of sight it’s the right time to pull out the macro charts which should turn your mind calm again. Here we go:
(Click on image to enlarge)

Looking at this chart, we can observe that the market finally broke an one-time-framing lower behavior which occurred for 3 Years. At a first glance a move to $25.00 USD would make some sense in my opinion, purely technically speaking, of course. That’s an observation and no advice in any form! Who knows, what will happen in the future and the current volatility in these markets could eat your money in a nanosecond. Secondly, call me a noob but I look at XAG/USD (CFD, Cash, Spot whatever) and not the current Silver futures contract. I avoid to need a premium god-mode data feed to analyze and trade this or another market.
Anyway, let’s move forward to the Quarterly view. The market one-time-framing higher into a past balance area currently, so a balanced behavior would not surprise me.
(Click on image to enlarge)

Monthly timeframe. There is not much to say. One time framing higher, trading into a past balance area. And there is this past resistance level. Current resistance? BS? Well, we can argue about that but we can see a reaction.
(Click on image to enlarge)

On the weekly timeframe we can identify a huge wick and a close in the middle of the week’s range. Sometimes huge wicks are there to get filled with bodies in the near future. An example is visible on this chart, too.
(Click on image to enlarge)

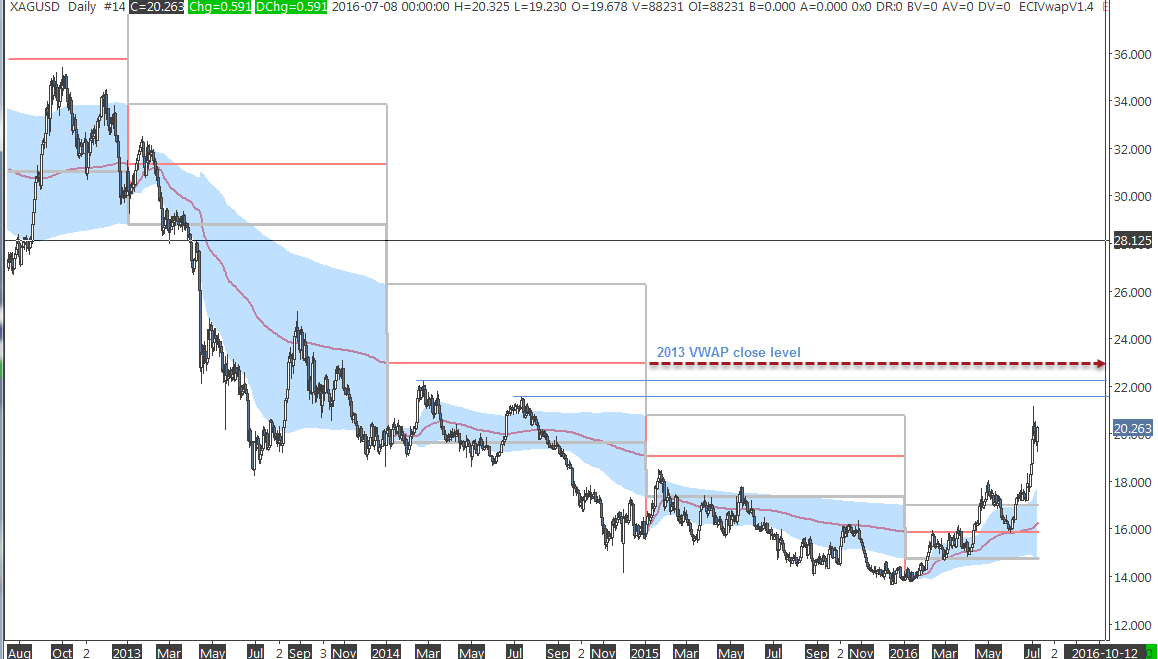
Time to look at the daily timeframe. Huge move up in a bullish manner, of course. However, we can observe some nice resistance at the value area high close level back from 2014. In the past week that level lead to some balanced behavior and ended on Friday’s session with a test of the bracket high.
(Click on image to enlarge)

If we can break through the previous swing highs, the next visible level of possible resistance could be the VWAP close level from 2013.
(Click on image to enlarge)
Actually, that’s it. Higher time frame is clearly imbalanced to the upside. Obviously, in a long-term view I want to be a buyer but currently the market is testing the daily balance area high. What we want to see is a clear break above the bracket high. It really depends on Monday’s open to conclude my next move on this silver chessboard.
Last but not least, I would like to avoid to brag about my Friday’s trade in Silver… News pushed the market firstly down. Panic goes around for some people for sure. With a clear mind I bought the next logical support level.
(Click on image to enlarge)


Comments
Log in or sign up to join the conversation.