


We’ll take a quick look at the Elliott Wave charts for Silver (XAGUSD). Silver has rallied from our buying zone as expected. The commodity may still be trading within the cycle that started from the 62.27 low. The recent pullback is a textbook example of an Elliott Wave Zig Zag pattern. In the analysis below, we’ll break down the pattern and show how we forecasted the path ahead.
Before we take a look at the real market example, let’s explain Elliott Wave Zigzag.
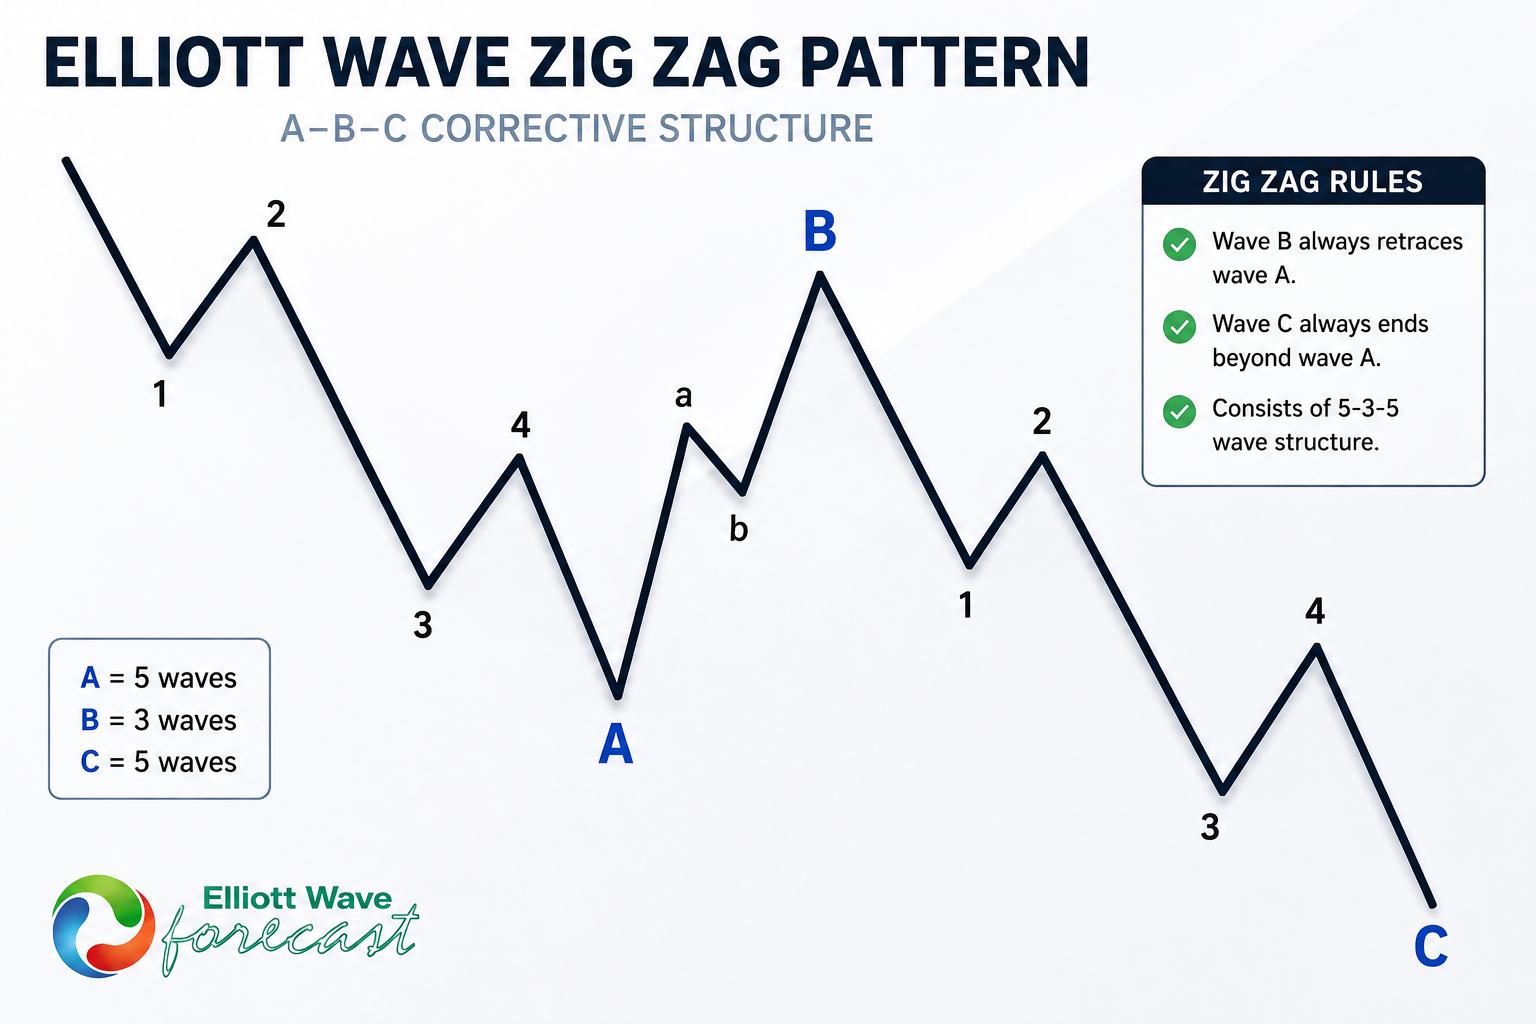
Elliott Wave Zigzag is the most popular corrective pattern in Elliott Wave theory . It’s made of 3 swings which have 5-3-5 inner structure. Inner swings are A,B,C where A =5 waves, B=3 waves and C=5 waves. That means A and C can be either impulsive waves or diagonals. (Leading Diagonal in case of wave A or Ending in case of wave C) . Waves A and C must meet all conditions of being 5 wave structure, such as: having RSI divergency between wave subdivisions, ideal Fibonacci extensions and ideal retracements.
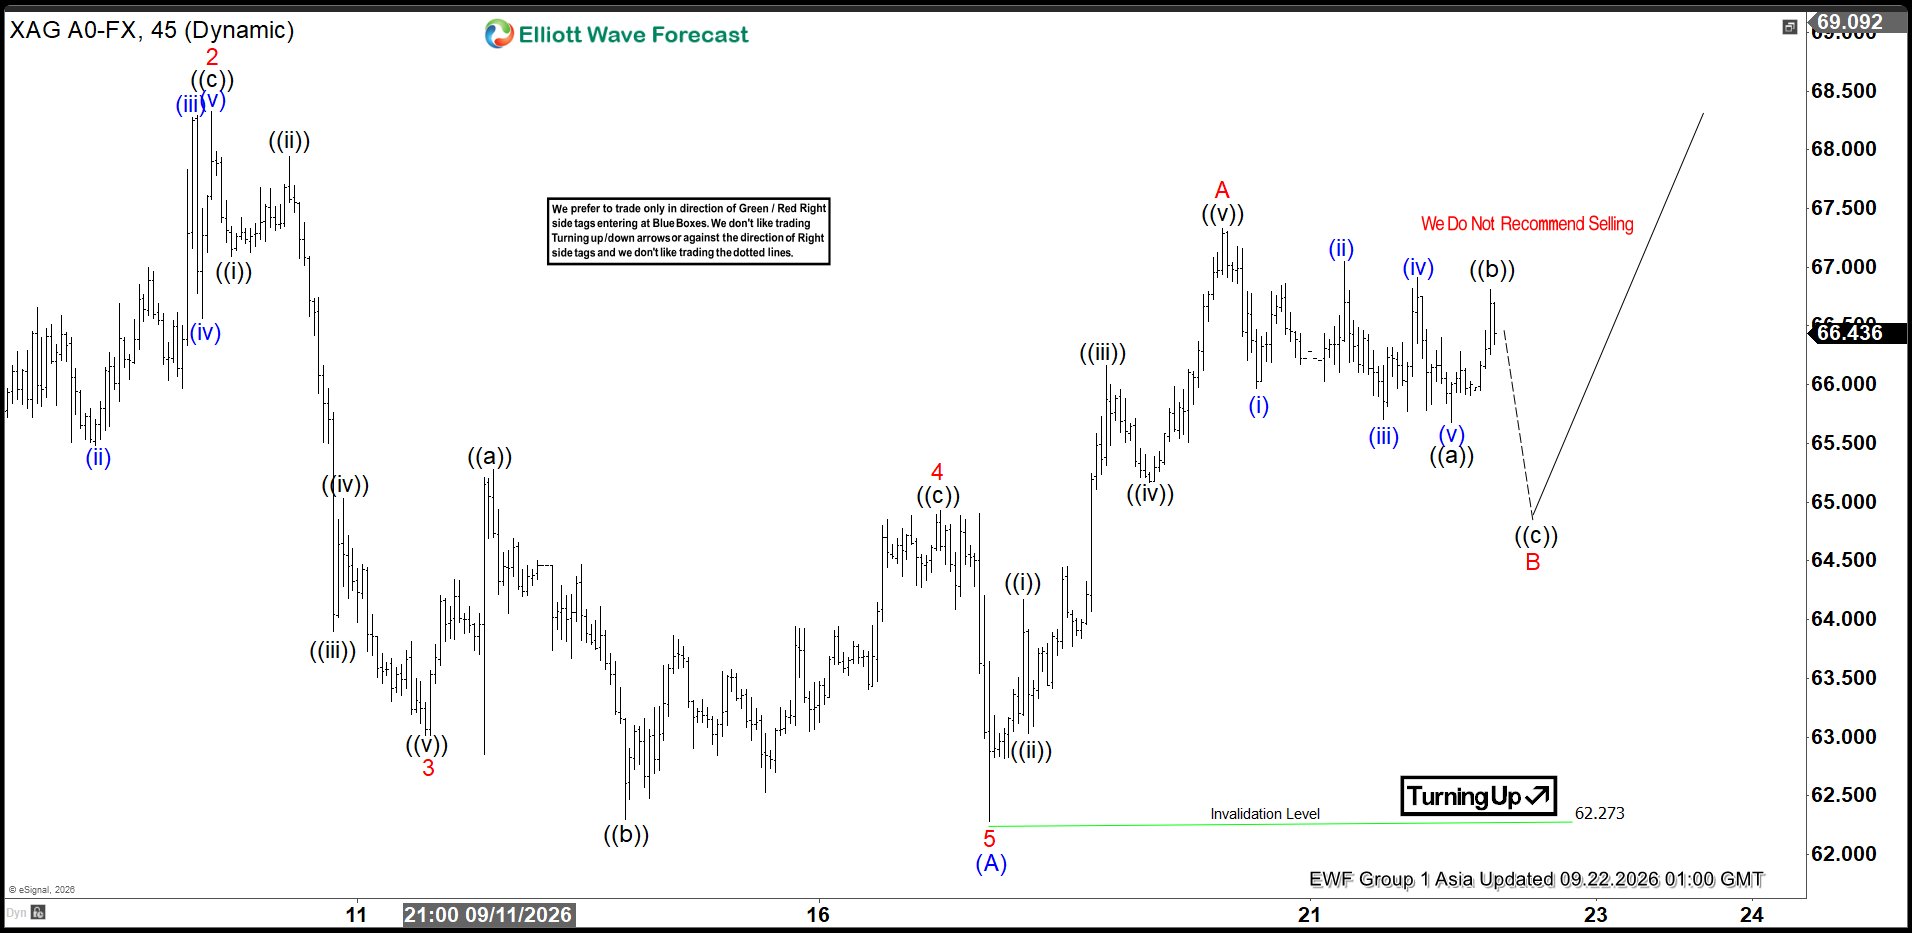
SILVER Elliott Wave 1 Hour Chart 09.22.2026
Silver is forming a 3-wave pullback from the recent highs. At the moment, the structure still looks incomplete. So far, we can count five waves down from the peak, suggesting that the pullback is forming an Elliott Wave Zig Zag pattern. Based on the current structure, we expect another 5-wave leg lower to complete the pullback. As our members know, we derive the buying zone by measuring the Equal Legs area with the Fibonacci Extension tool.
While price remains below the latest short-term high, marked as ((b)) black, the ideal target area comes at 65.15–64.13. Once Silver reaches this zone, we expect buyers to step in and take control. From there, we look for a strong bounce in at least three waves, with the potential for the rally to eventually reach new highs.
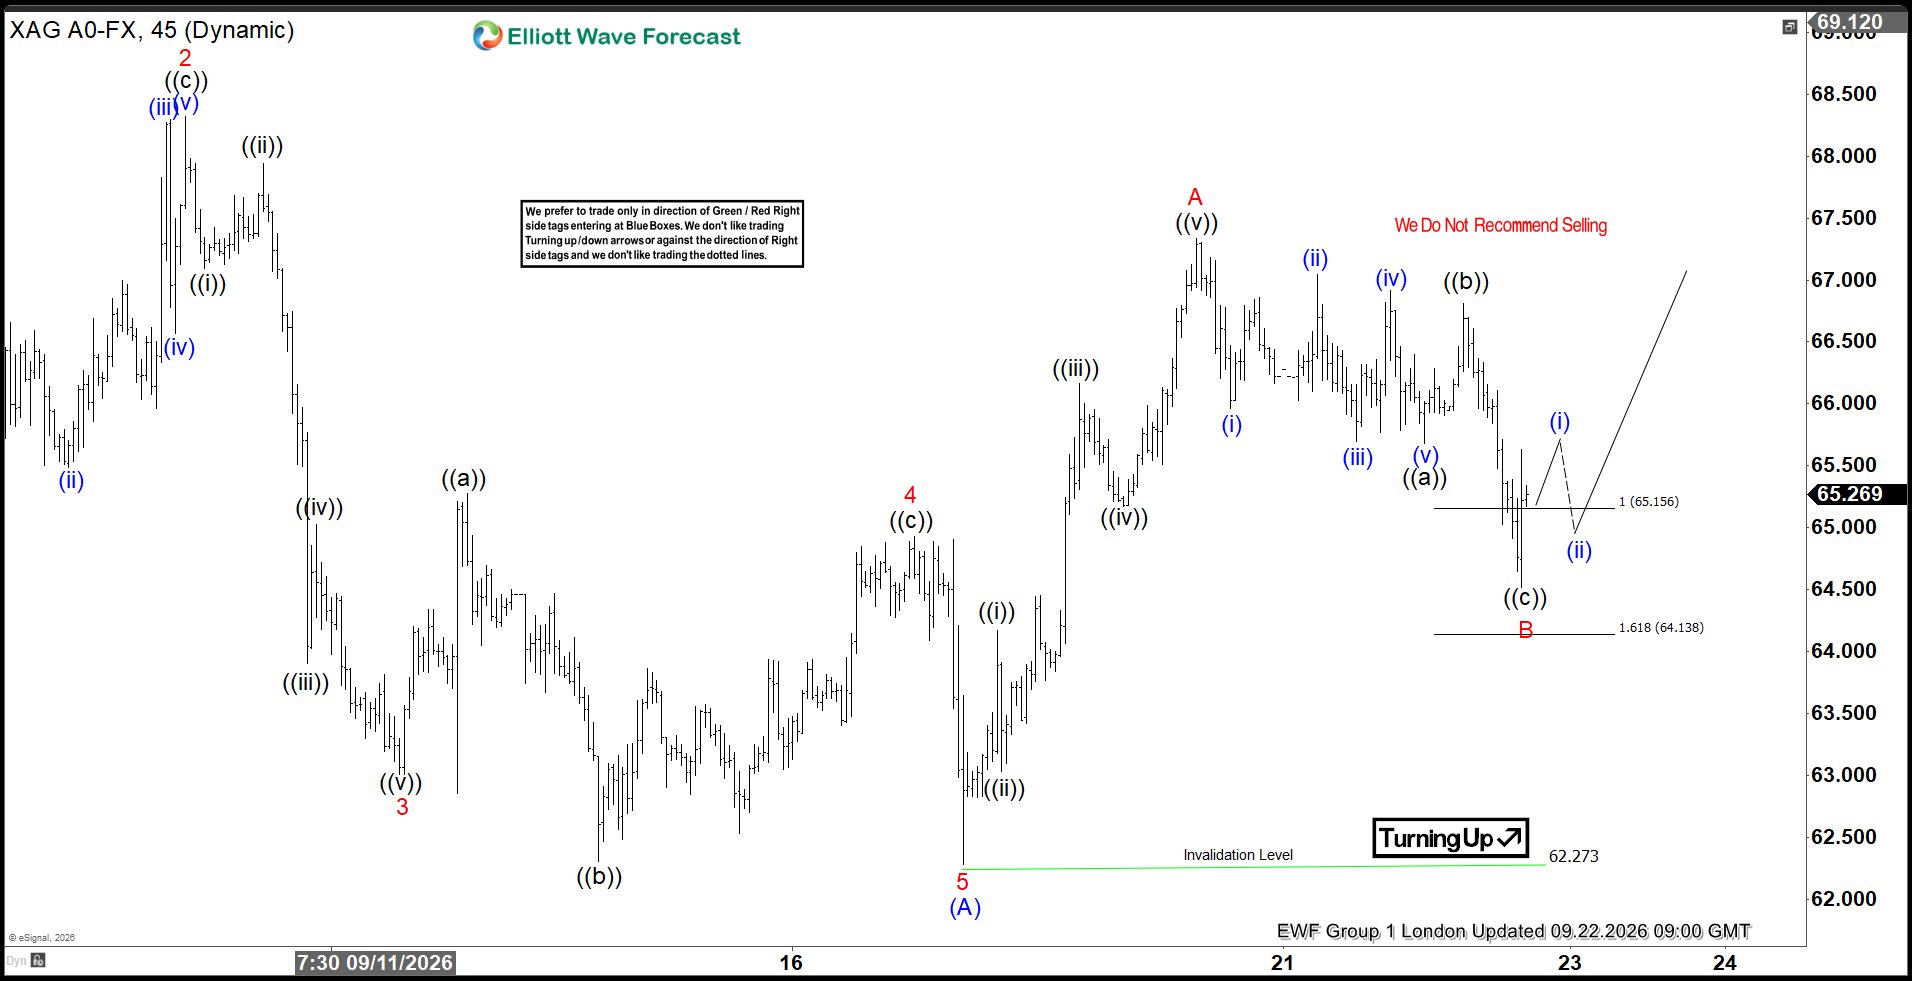
SILVER Elliott Wave 1 Hour Chart 09.22.2026
The commodity made the decline as expected. Price reached our target area at 65.15–64.13, the buying zone, and has already found support there. From this zone, we expect buyers to step in and push Silver higher, with the potential for a further rally toward new highs.
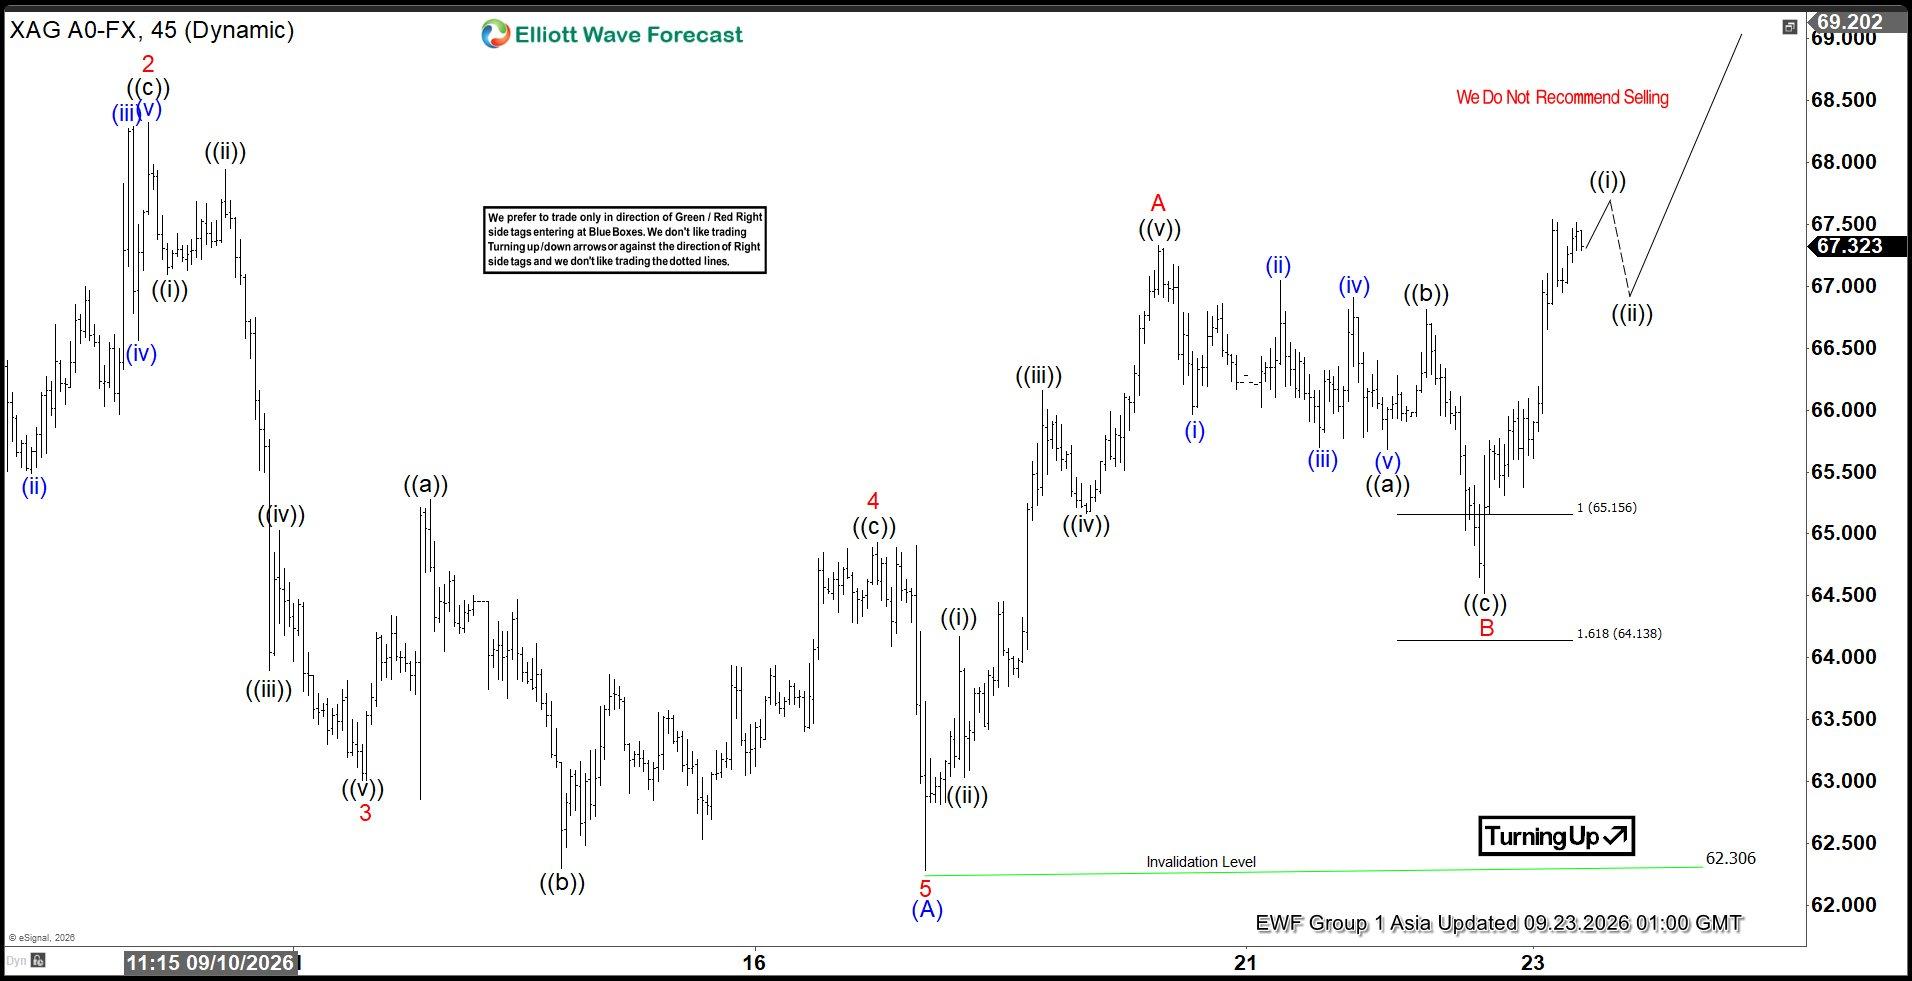
SILVER Elliott Wave 1 Hour Chart 09.23.2026
The price rallied as expected and made a new short-term high, confirming a bullish structure within the cycle from the 62.3 low. We now expect a 3-wave pullback to develop. The key level to watch is the B red low at 64.58. As long as this pivot holds, further upside can be seen in the C red leg.
Keep in mind that the market is dynamic, and the outlook may have changed in the meantime. Our member Chat Rooms are open 24 hours a day, Monday through Friday, on trading days, providing ongoing expert guidance on market trends and Elliott Wave analysis. Members can ask questions about market structure and technical setups at any time during trading days.



Comments
Log in or sign up to join the conversation.