

(Click on image to enlarge)
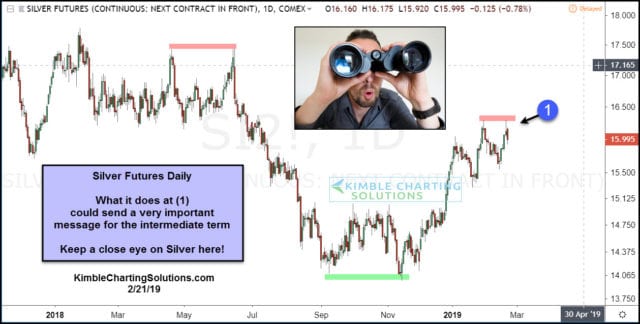
Could Silver be creating a topping pattern at current prices? Possible, still too soon to tell though!
The first chart looks at Silver Futures on a daily over the past 18-months. The rally since Mid-November reflects that Silver is testing highs of a few weeks ago at (1).
Below looks at Silver on a monthly basis over the past 40-years-

(Click on image to enlarge)
This long-term chart highlights that Silver peaked in 2011 at the same price as it topped in the early 1980s.
The rally of late has it testing falling monthly resistance at (1), which could be the top of a descending triangle. Both of these charts reflect that Silver is testing very important level on a daily and monthly basis currently!
Metals bulls would love to see a breakout from current levels. They would receive short-term concerning news if selling pressure gets started at current levels! Keep a close eye on Silver here friends as the current price point looks to be very important for Silver!



Comments
Log in or sign up to join the conversation.