
As extraordinary events happen in global markets right now, conflicting fundamental data can be hard to decipher. We had pandemics before. 1889 Russian flu pandemic, 1918 Spanish flue pandemic. 1957 Asian Flue Pandemic, 1968 Hong Kong flue pandemic and 2009 H1N1 flue pandemic. Unfortunately, historical data on how the markets reacted seems in-congruent. We also find ourselves in a unique situation right now just from a financial market perspective itself, so it isn’t always wise to take past data and assume a repetition. Once the mind gets data overload it desires logic and order that much, that it will pick almost randomly any cause and effect model that might make sense. The relief felt is easily expanded on. That doesn’t mean, that this stream of thought is principle based. Neither, that it provides the edge needed for decision making if and when to participate in the markets. Back to basics.
A backup protocol is required.
Charts are for the most parts an accurate reflection of all data, encompassing perception of all market speculators as a sum. It is a good foundation to regroup by simply starting from scratch. Watch a top down (in time frame) very basic set of charts. There are no comprehensive indicator setups neither a complex strategy approach.
Silver Monthly Chart – Good Setup:
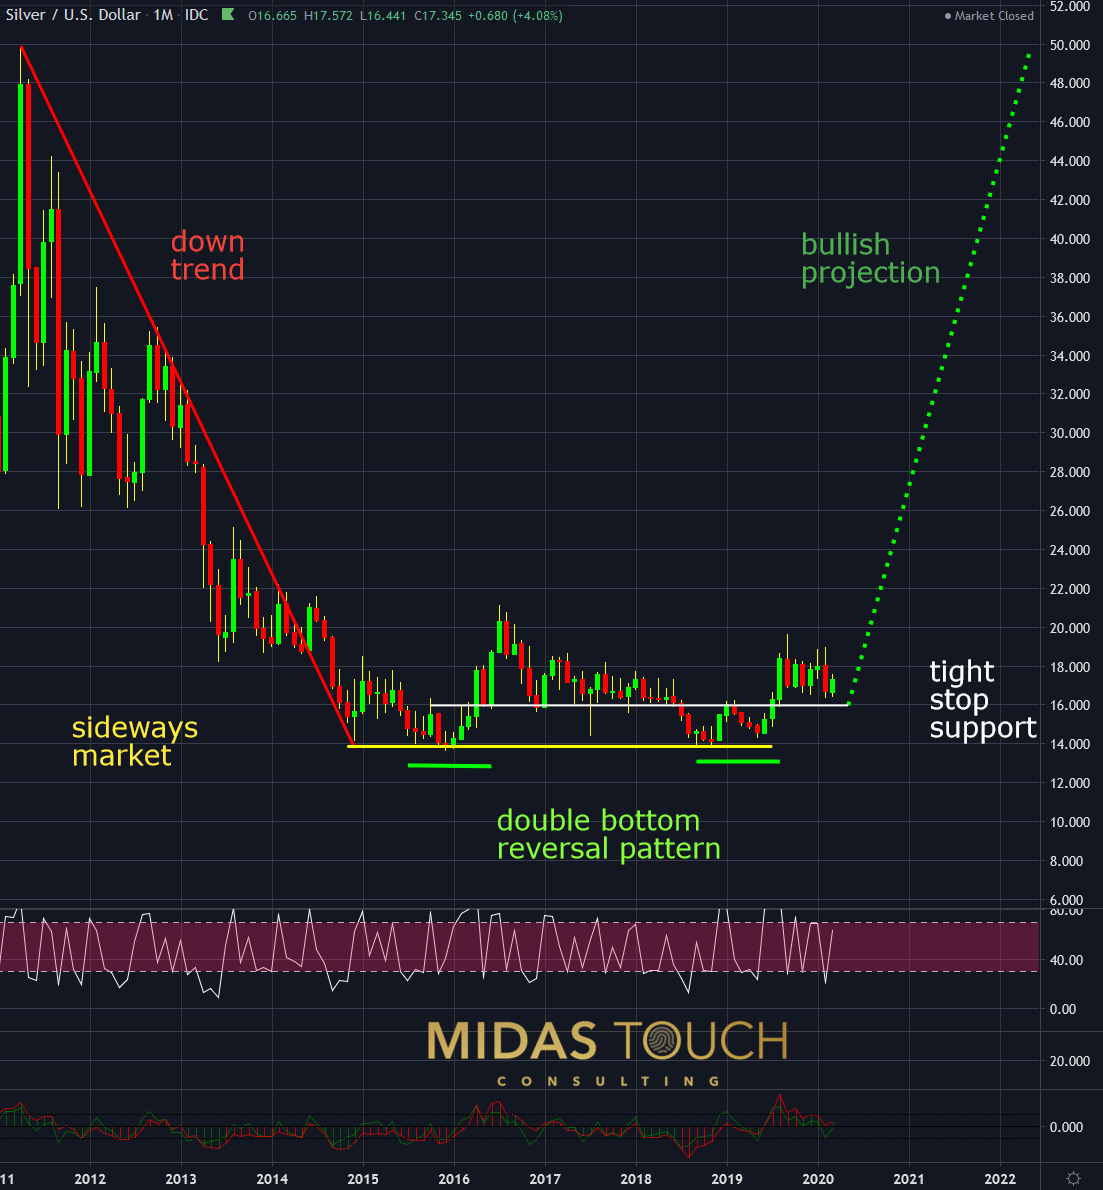
Silver in US Dollar, monthly chart as of March 6th, 2020
Back to basics:
From 2011 to the end of 2014 prices declined in a down trend fashion.
From 2015 to 2019 the silver market traded sideways. Within its sideways channel in that time frame it built a bullish double bottom reversal pattern.
The monthly chart depicts near the price US$16 a good support zone of supply. This allows for the aggressive monthly time frame player a good risk reward ratio for a long play with a tight stop.
Silver Weekly Chart – Sideways:
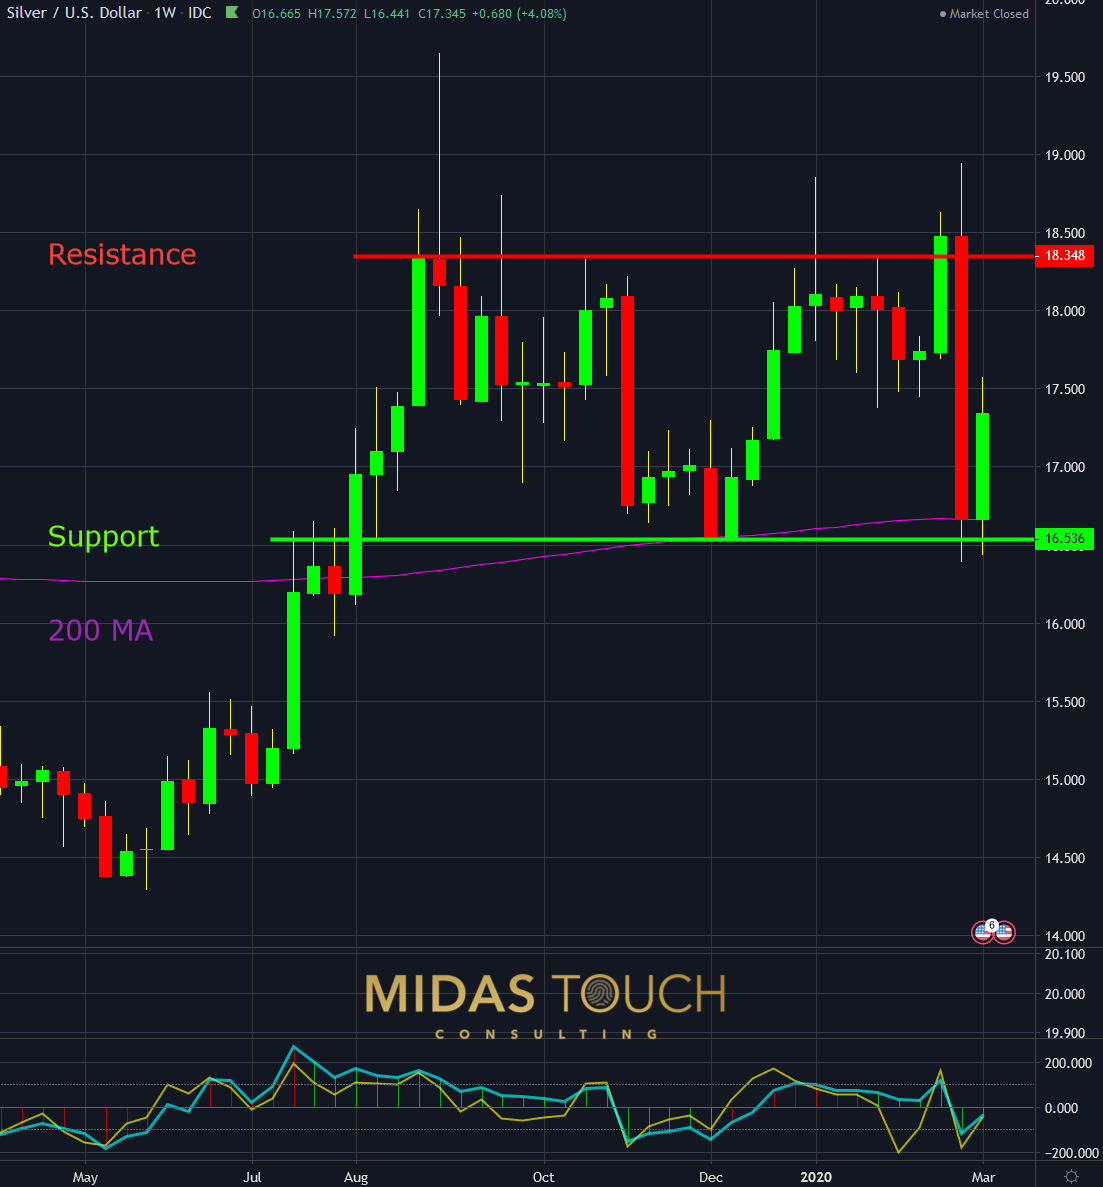
Silver in US Dollar, weekly chart as of March 6th, 2020
The weekly time frame shows clearly a sideways channel. With prices trading in the middle of the range, even with slightly bullish consensus, there is no setup for a low risk entry point just now.


Comments
Log in or sign up to join the conversation.