

The Silver chart (XAG/USD) is showing a lot of potential for the bulls. The strong surge from $12 to almost $30 during March and July 2020 was an extremely impulsive price swing.

Image Source: Pixabay
Is a breakout nearby? And what kind of bullish targets are possible? Let’s review the key chart and wave patterns.
Price Charts and Technical Analysis
(Click on image to enlarge)
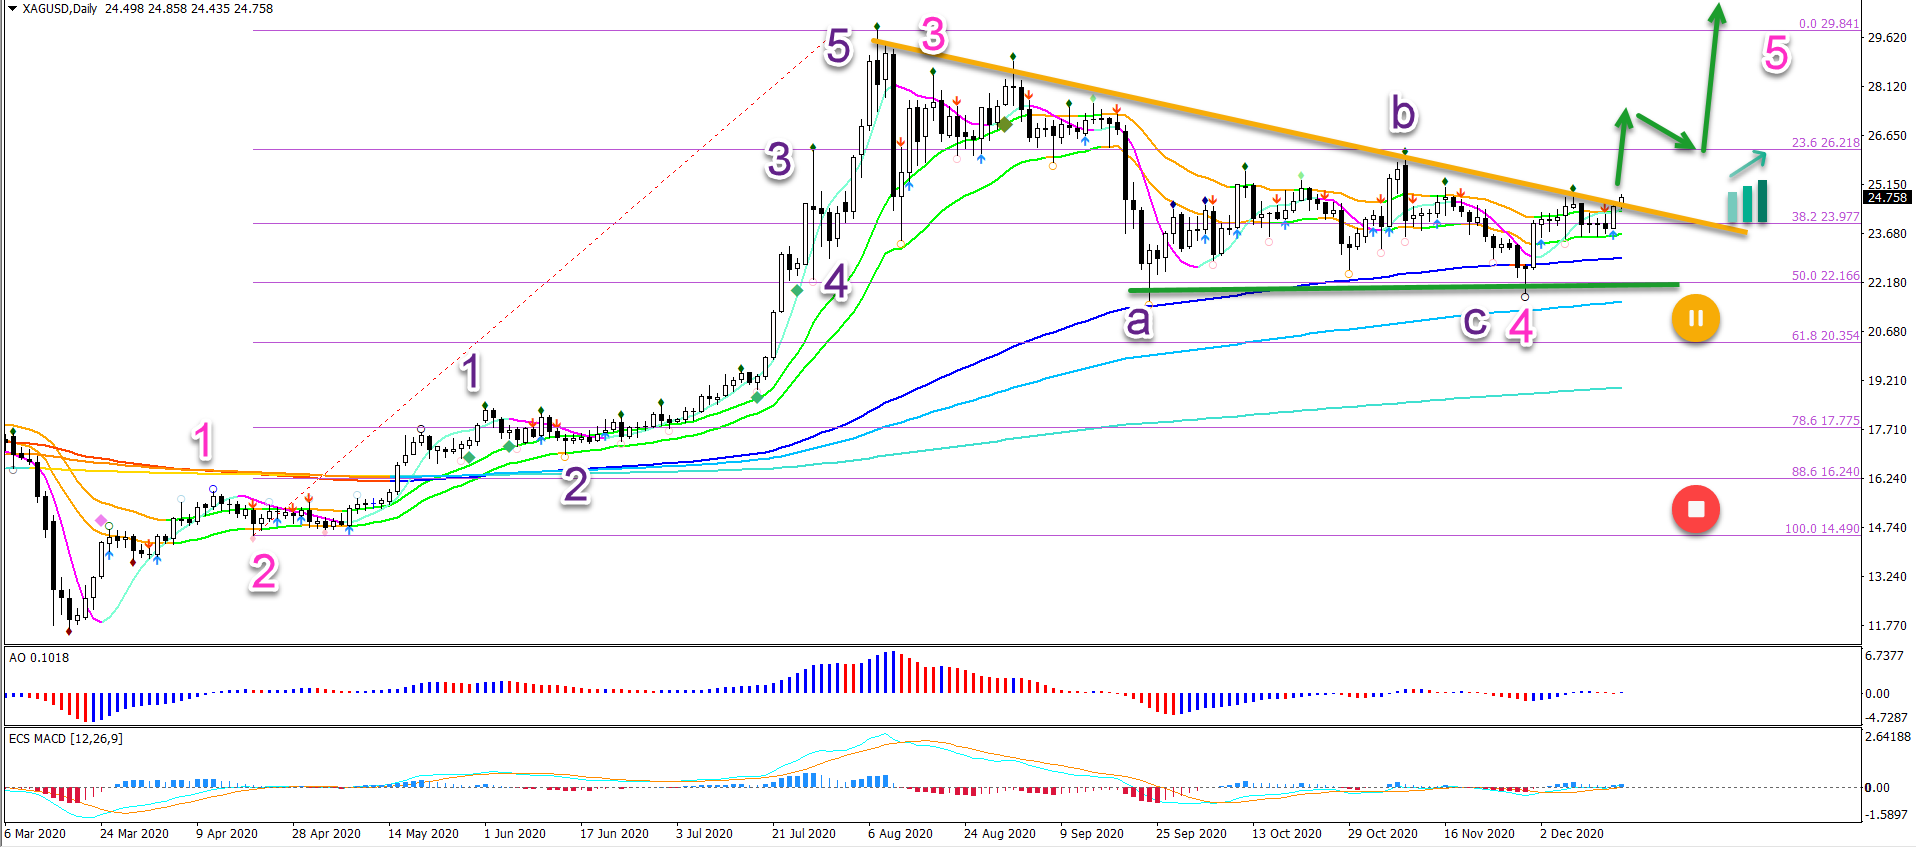
The XAG/USD needs to break above the resistance trend line (orange) and fractal to confirm the uptrend continuation.
This break would confirm the currently expected wave pattern. Which is a wave 12345 (pink). The most recent top is probably a wave 3 and the current pullback a wave 4.
This wave outlook remains valid as long as price stays above the 50% Fib. A break below the support places it on hold (yellow) and a deeper break indicates an invalidation (red).
The main targets are located at the Fibonacci levels, such as:
- -27.2% Fibonacci target at $34.78
- -61.8% Fibonacci target at $41.07
- -100% Fibonacci target at $48 and previous top
- A break of the top
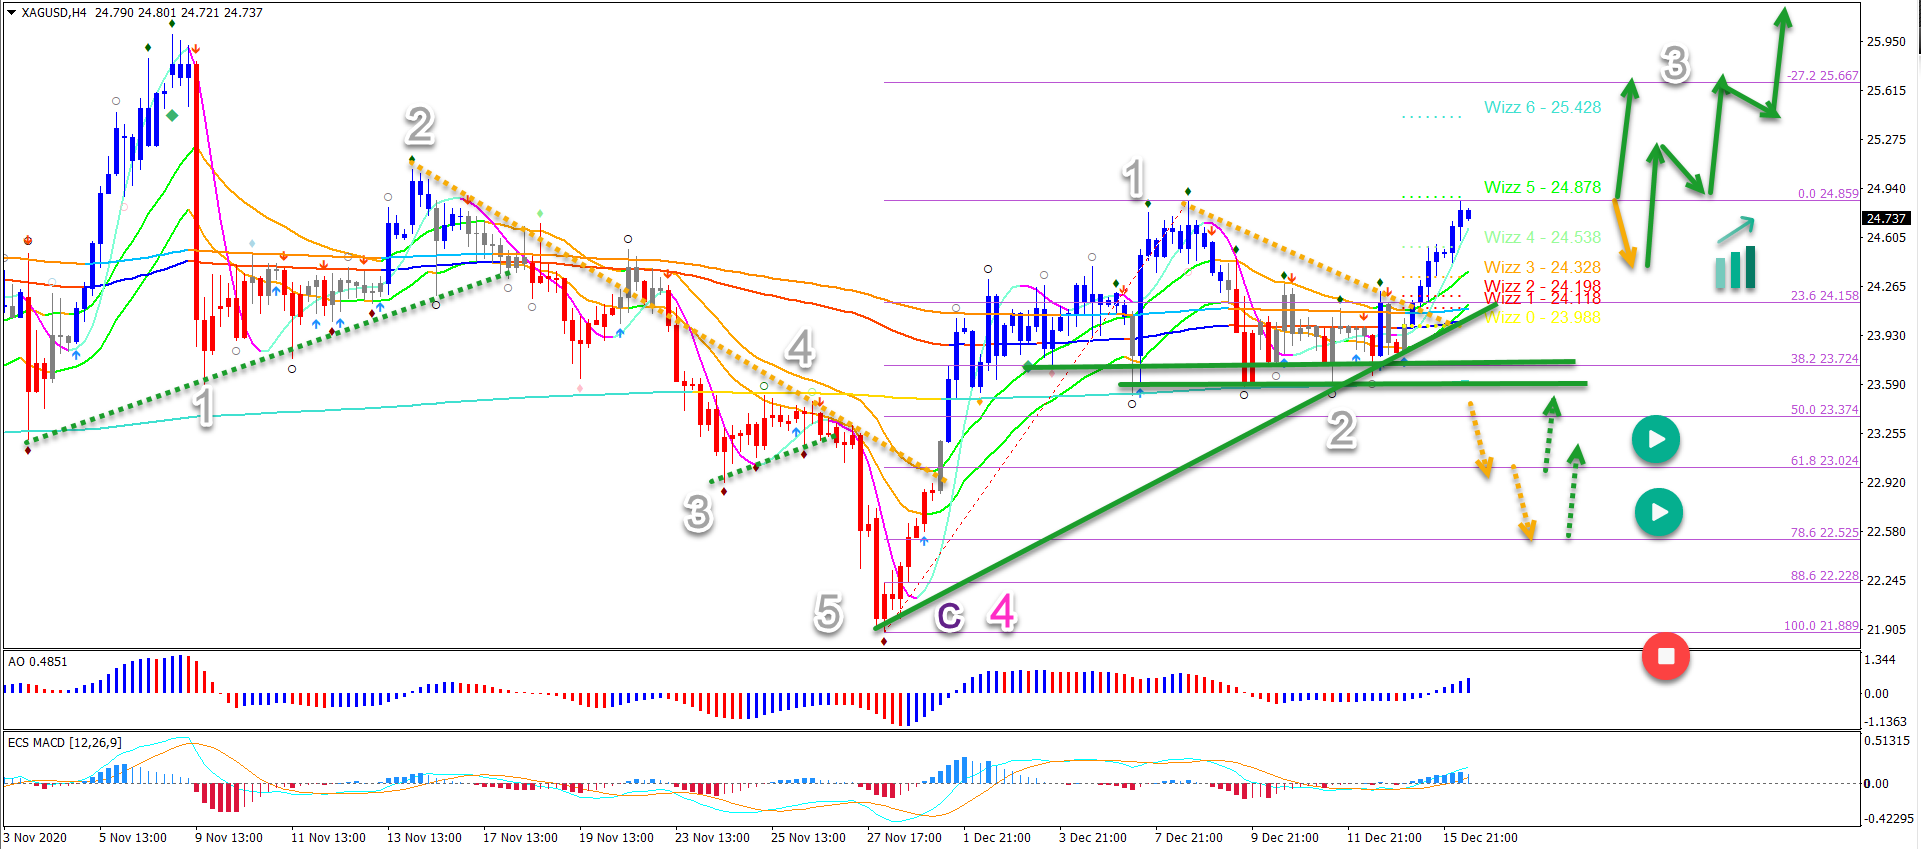
On the 4 hour chart, price action could have completed a 5 wave (grey) pattern within the wave C (purple) at the lowest low.
The current bullish momentum is probably a wave 1 (grey) pattern. And the pullback might have completed a wave 2 (grey).
But price action needs to break above the top. A failure to break could indicate a deeper pullback (dotted orange arrows).
The Silver chart looks bullish either after a breakout or after a pullback.
(Click on image to enlarge)



Comments
Log in or sign up to join the conversation.