

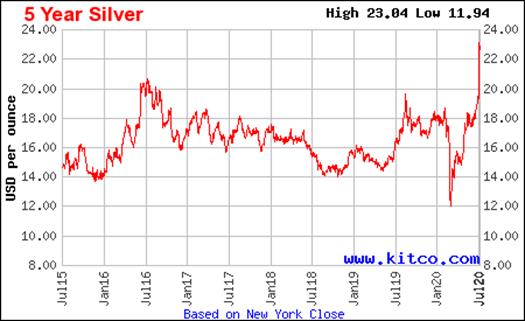
With Silver near $23, the metal has been on fire since touching $12 in mid-March, up an astounding 90% since then.
And although silver has started to approach overbought levels, it could still continue to run higher from here.
What’s driving silver and how high could it go?
(Click on image to enlarge)
When the Covid-19 pandemic hit in March, by early May nearly 66% of global annual silver output was on hold, with mining suspended in 32 countries, according to GlobalData. That made silver the hardest hit commodity of all, especially with more than 60% of primary silver production coming from just four countries: Mexico, Peru, Chile, and Argentina.
So supply has clearly been down in a big way.
Physical Silver Demand Soars
Meanwhile, demand has skyrocketed.
Physical silver demand was up nearly 100 million ounces in 2019 over 2018, setting an all-time record.
And if we look at SLV, the behemoth silver ETF which holds almost half of all the silver in worldwide silver ETFs, the action has been astounding.
(Click on image to enlarge)
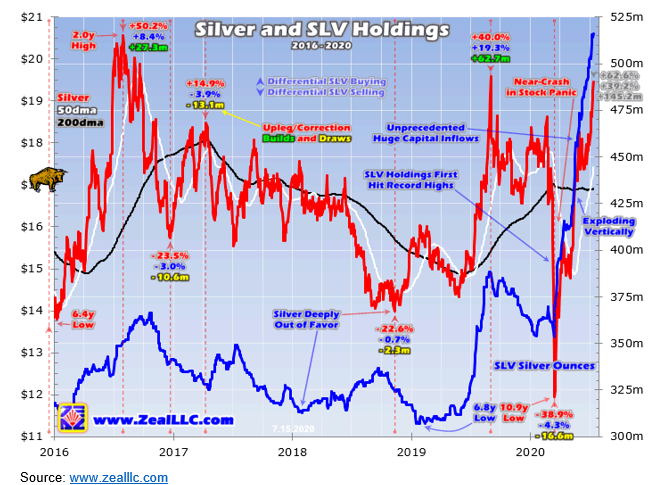
The blue line in this chart tracks the number of silver ounces held by SLV. Already by the end of 2019, physical silver holdings had reached over 380 million ounces. They then retreated with the silver price in March, but never went below 350 million ounces.
Since then, holdings have erupted higher, going from 350 million ounces to the current level near 520 million ounces. Not only is this almost a 50% build in holdings over just 4 months, it’s also a record high since inception of the SLV ETF over 14 years ago.
So physical demand through ETF buying is likely a big driver that’s pushing silver higher.
Gold/Silver Ratio Reverts
Climbing gold prices and a sky-high gold/silver ratio have certainly buoyed silver prices as well.
Chart: Long Term Gold/Silver Ratio
(Click on image to enlarge)
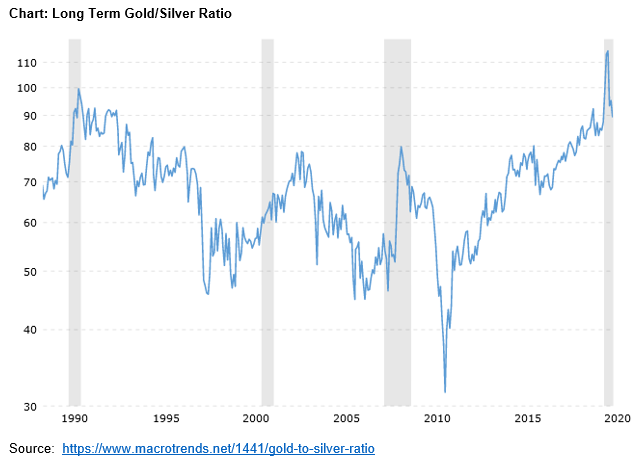
When the ratio reaches extremes is when it’s most valuable as an indicator. When it has gone above 80, silver is typically a major bargain versus gold. The last few times the ratio has reverted from those levels, silver gained hundreds of percent.
More recently the ratio has soared to an all-time high of 124 to 1 in mid-March, meaning it took a record 124 silver ounces to buy one gold ounce. Since then the ratio has fallen to its current level of 83, and this while gold prices have been rising strongly.
That simply means that silver has been climbing even faster than gold. And with the ratio still well above 80, odds are it has even further to run.
The Dollar is Breaking Down
With stimulus and money printing out the wazoo, naturally the U.S. dollar is being pressured downwards as investors recognize the effects of a mushrooming money supply.
That of course works in silver’s favor. The more dollars circulating, the less valuable each new dollar becomes, the more it takes to buy a valuable commodity with soaring demand.
(Click on image to enlarge)
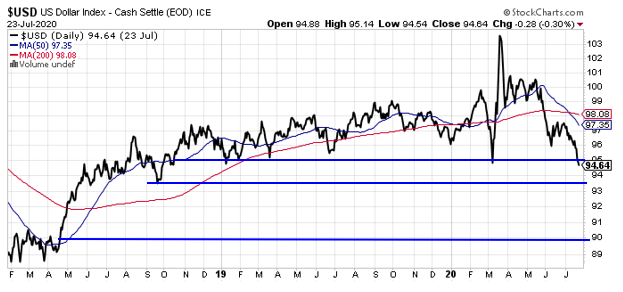
The US Dollar Index temporarily peaked at 103 in March and has fallen considerably since. It has broken strong support at 95. It’s worth watching closely. If the US Dollar Index breaks below 93.5, the next support is way down at 90.
What’s Next for Silver?
Silver’s close above $20.57, a level it reached in mid-2016, mean it’s established a new 4-year high.
(Click on image to enlarge)
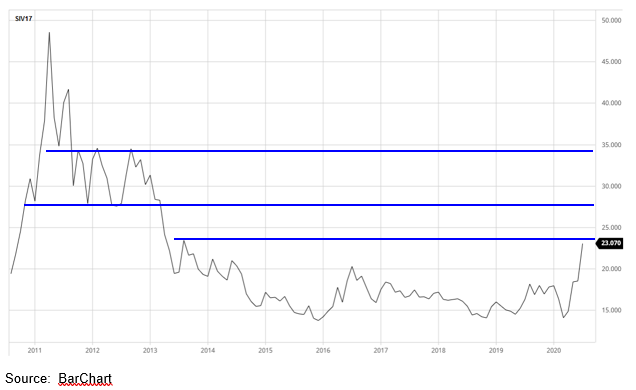
From there, the next overhead resistance is at $24, then $28, followed by $34. In my view, silver can easily reach the $24 level this year, perhaps even $28.
A near-term pullback in silver is not out of the question after such a tremendous runup. But fundamental and technical drivers point to considerably higher silver prices.
Stay long silver.


Comments
Log in or sign up to join the conversation.