

Following futures positions of non-commercials are as of July 21, 2026.
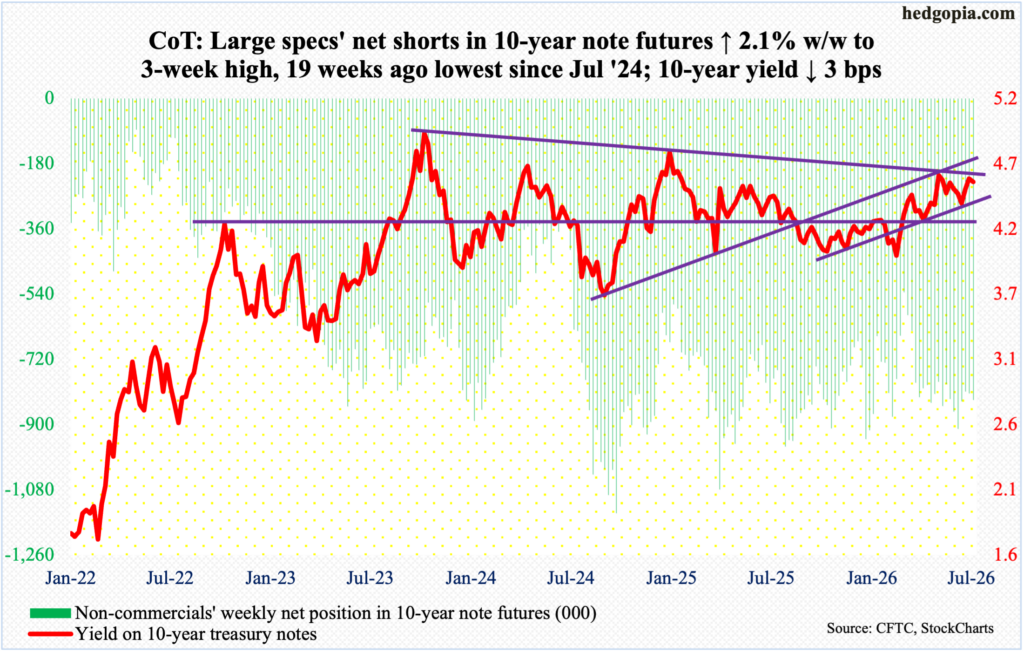
10-year note: Currently net short 879.7k, up 48k.
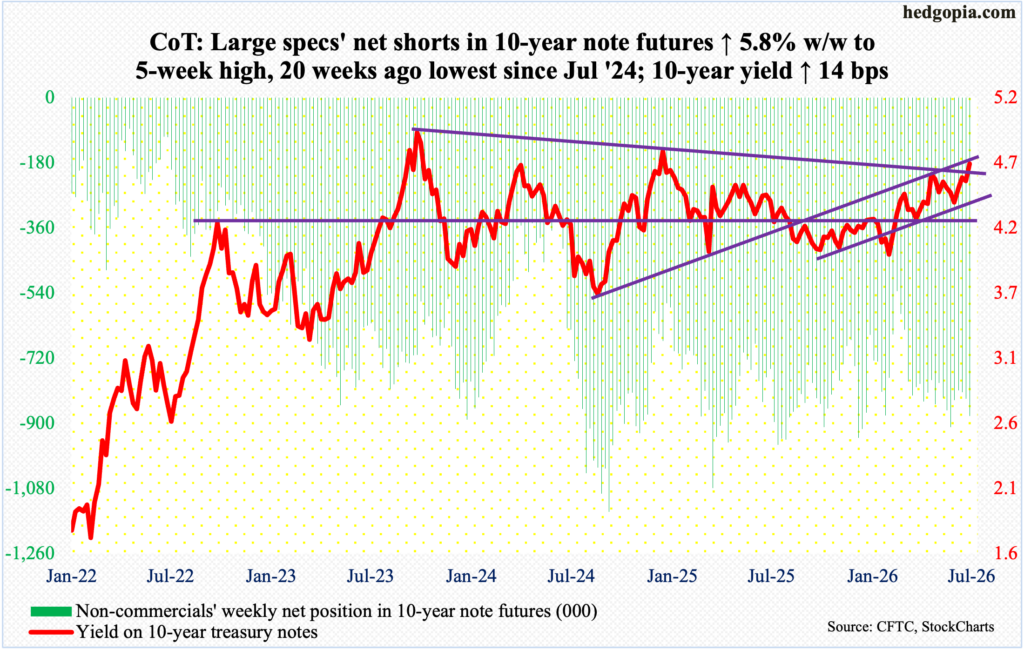
The FOMC (Federal Open Market Committee) meets next week (28-29), and this will be the second meeting chaired by newly appointed Chairman Kevin Warsh. In the first, he may have ruffled a few feathers by saying “this committee will deliver price stability”. He has stuck to a rather hawkish take on inflation since. The continued conflict in the Middle East and the resultant upward pressure on crude oil prices hardly help soothe his, or other members’, inflation concerns. Inflation has remained above the Federal Reserve’s stated goal of two percent for five years now.
Going into the meeting, the fed funds rate is expected to be left unchanged at a range of 350 basis points to 375 basis points, even though futures traders are betting with 34 percent probability that the benchmark rates will be hiked by 25 basis points. They will get their wishes fulfilled in the September meeting for sure; markets will be hugely disappointed if the FOMC does not vote for a quarter-point raise during that meeting. As a matter of fact, futures traders are girding for yet another hike of a similar size come December.
Next week’s meeting hence will be a non-event from rates’ perspective but should help provide a window into several more meetings to come.
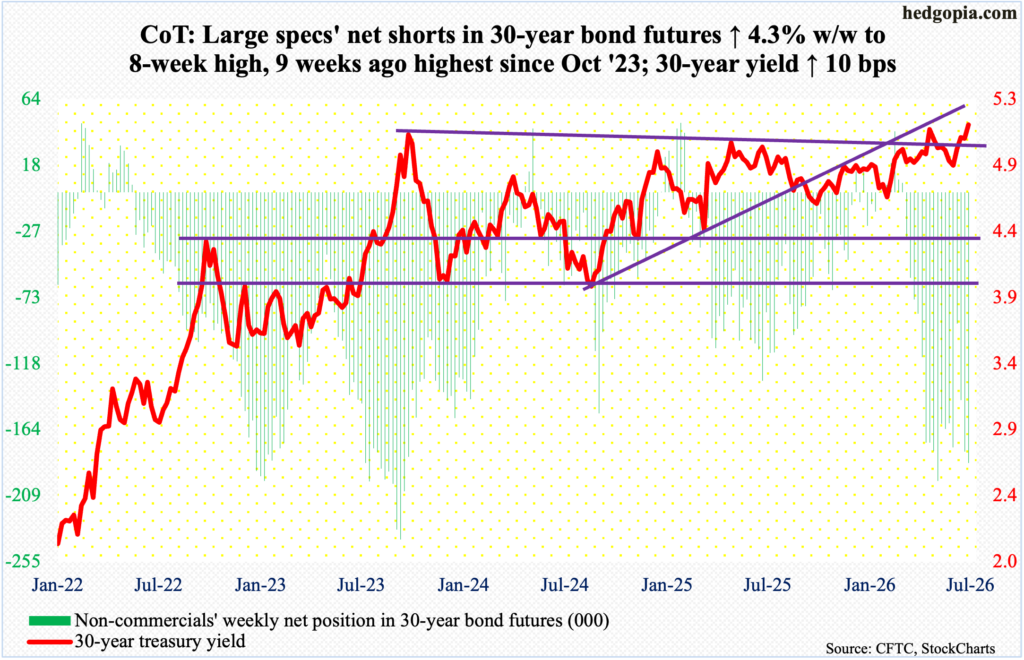
30-year bond: Currently net short 186.8k, up 7.7k.
Major US economic releases for next week are as follows.
Durable goods orders (June) are on schedule for Monday. Orders for non-defense capital goods ex-aircraft – proxy for business capital spending plans – increased 1.6 percent month over month in May to a seasonally adjusted annual rate of $84 billion, which is a record.
The S&P Cotality Case-Shiller home price index (May) is due out Tuesday. In April, home prices nationally inched up 0.9 percent from a year ago. This is slightly up from March’s slowest annual price appreciation in 33 months of 0.7 percent.
Thursday brings GDP (2Q26, advance) and personal income/spending (June).
In the March quarter, real GDP grew 2.1 percent annually. The September quarter’s 4.4-percent growth set an eight-quarter high.
In the 12 months to May, headline and core PCE (personal consumption expenditures) increased 4.1 percent and 3.4 percent respectively to a 37- and 31-month high.
The employment cost index (2Q26) and University of Michigan’s consumer sentiment index (July, final) will be published Friday.
In the March quarter, private-industry compensation rose 3.4 percent year over year. This was the eighth consecutive quarter of growth of sub-four percent.
July’s preliminary count showed consumer sentiment jumped 4.9 points m/m to 54.4, which is nearly 10 points higher than May’s record low 44.8.
WTI crude oil: Currently net long 94.2k, up 14.7k.
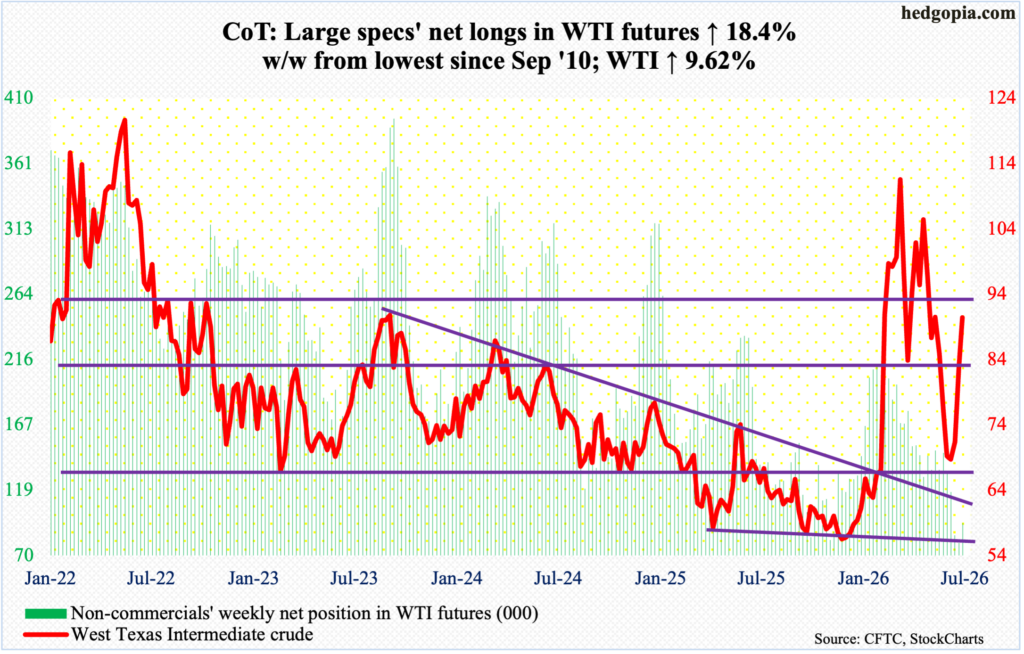
Oil bulls latched on to the ongoing closure of the Strait of Hormuz plus Houthi attacks on tankers in the Bab el-Mandeb Strait to rally West Texas Intermediate crude 9.6 percent this week to $90.42/barrel, having ticked $93.50 intraday Thursday. This was the third up week in a row.
Earlier, the crude bottomed at $67.04 on the 2nd this month, filling a gap from March 2 when WTI gapped up in response to the February 28 launch of a military attack by the U.S. and Israel on Iran. On February 27, the crude closed at $67.02, with a session high of $67.83 and a low of $64.85.
The 50-day moving average ($84.22) was reclaimed this week; in the prior week, the 200-day ($75.16) was retaken.
That said, Thursday’s high drew sellers at trendline resistance from March 9 when WTI tagged a four-year high $119.48 and reversed lower. The daily is extended, and the 50-day can act as a magnet right at this moment.
In the meantime, as per the EIA, US crude production in the week to July 17 declined 63,000 barrels per day week over week to 13.798 million b/d; the prior week’s 13.861 mb/d was only 1,000 short of the record 13.862 mb/d posted in the week to November 7 last year. Crude imports rose 117,000 b/d to 5.81 mb/d. As did stocks of crude, gasoline, and distillates, which respectively increased two million barrels, 765,000 barrels and 1.4 million barrels to 411.7 million barrels, 211.3 million barrels and 109.6 million barrels. Refinery utilization edged down one-tenth of a percentage point to 96.1 percent.
E-mini S&P 500: Currently net short 16.8k, down 22.2k.
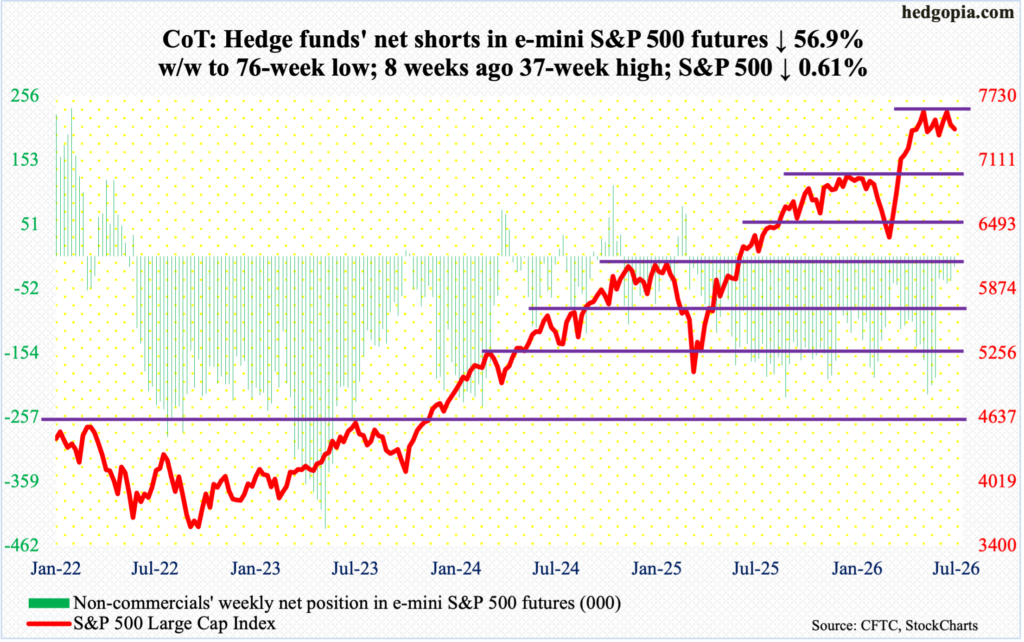
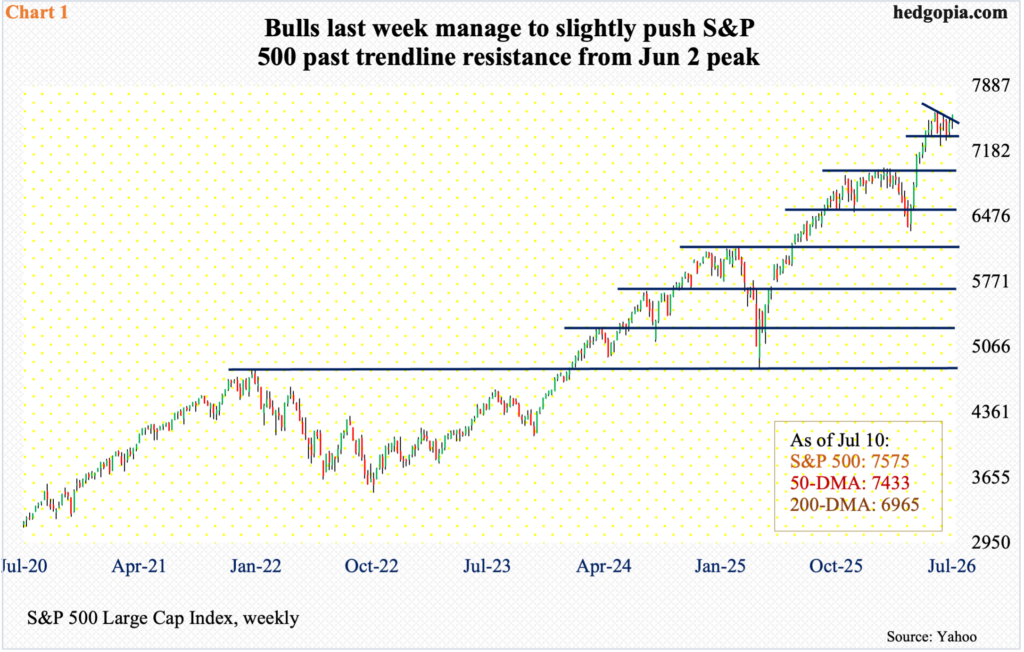
Rallies were sold in four out of the five sessions, with the week down 0.6 percent to 7412. This was the second down week in succession. Things are evolving this way at a time when non-commercials have reduced their net shorts to the lowest since February last year; early June, their bearish holdings touched a 37-week high.
Bulls this week also failed to save the 50-day (7472). In the past month and a half, the average has been tested several times. This week’s breach coincides with a drop out of a pennant, which goes back to June 2 when the S&P 500 peaked at 7621; earlier on March 30, the large cap index bottomed at 6317.
The action of late has squeezed volatility to a point where a sharp move either way is just a matter of time. Given how the index is trading, a move to the downside is a safe bet than up, as things stand. The 200-day lies at 7006, and this lines up with a crucial breakout retest at 7000, or just underneath.
Euro: Currently net short 41.3k, up 28.7k.
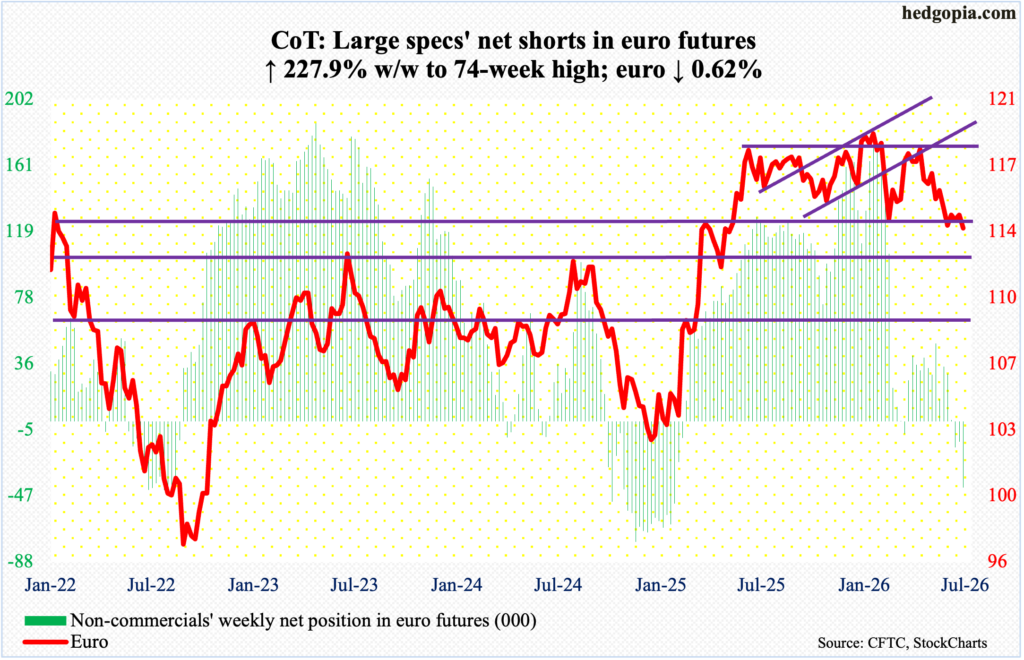
Non-commercials continued to add to net shorts – now at a 74-week high – having just switched bearish three weeks ago.
This week, the euro gave back 0.6 percent to $1.137. This is a make-or-break level as far as the bulls are concerned.
For more than a year, the currency played ping pong between $1.14 and $1.18. Along the way, it tagged a four-and-a-half-year high $1.208 on January 27, then dropping to $1.141 by March 13; that low was breached on June 23, with $1.132 tagged in the next session. The rally that followed, however, met with resistance at $1.147s; Monday, the euro tagged $1.145.
Bulls are struggling to get going even in the face of growing trader anticipation of a rate hike in September. On Thursday, the European Central Bank held benchmark rates steady at 2.25 percent, even as President Christine Lagarde warned of upside risk to the eurozone inflation outlook.
Gold: Currently net long 183.9k, down 2.8k.
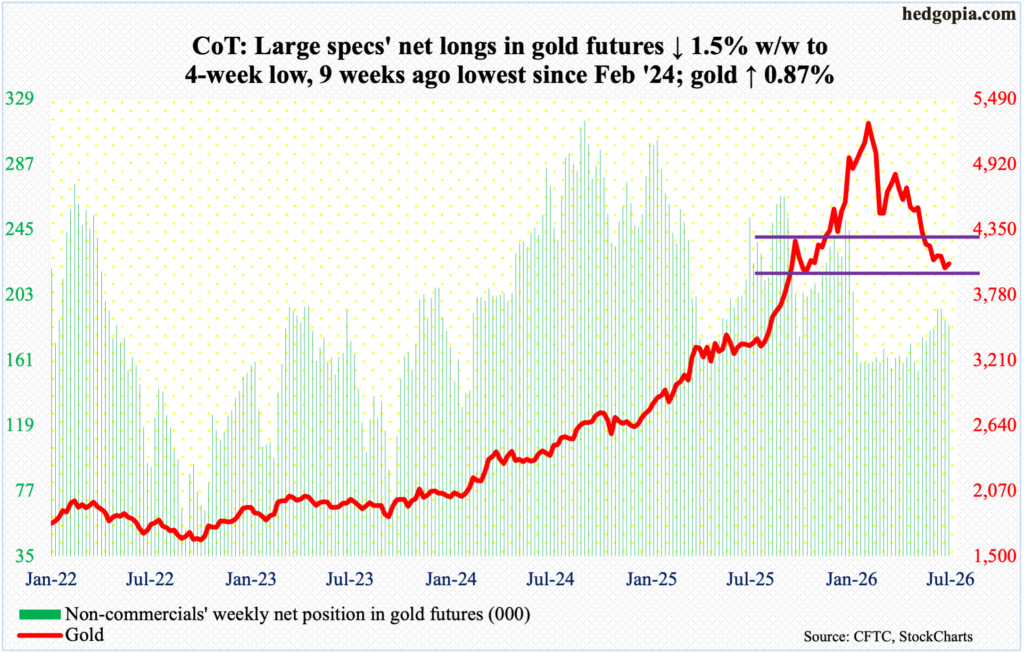
Gold continues to try to stabilize just above horizontal support at $3,900. For five weeks in a row, the metal made weekly lows between $3,900 and $4,000, with this week’s low of $3,983 tagged on Monday. For the week, it gained 0.9 percent to $4,052/ounce.
Gold has been under pressure ever since peaking at $5,608 on January 29, followed by a series of lower highs. In October 2023, it bottomed at $1,810, and at $3,312 last August, so long-term longs are not faring that bad.
Eight weeks ago, gold failed to defend horizontal support at $4,370s, before gravitating toward the current level. It has gone sideways above $3,900 for several weeks now. It is about time it reverses higher; else, risks of a breach of $3,900 will have meaningfully risen. Next decent support lies at $3,430s.
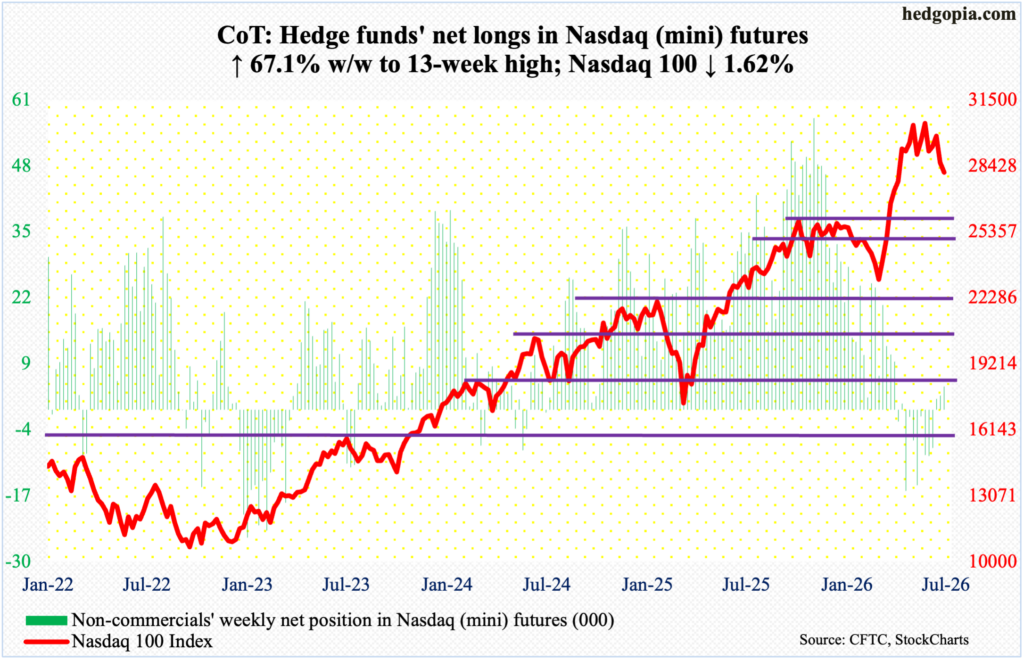
Nasdaq (mini): Currently net long 4.5k, up 1.8k.
Next week, more U.S. tech heavyweights will be reporting the June quarter, with Microsoft (MSFT) and Facebook parent Meta Platforms (META) due out on the 29th and Apple (AAPL) and Amazon (AMZN) on the 30th. This week, results from Google parent Alphabet (GOOG), Tesla (TSLA) and Intel (INTC) all beat expectations but were received poorly in the markets.
The Nasdaq 100 this week declined 1.6 percent to 28128, with Friday’s intraday low of 28053, which ever so slightly breached the June 9 low of 28197. Odds are high the tech-heavy index goes on to lose this support in the sessions ahead.
Long-term bulls are sitting on tons of gains, as the Nasdaq 100 surged 34.7 percent between March 30 when it bottomed at 22841 and June 3 when it peaked 30762. For several weeks after that high, the index hit the wall at 30600s, followed by a loss seven sessions ago of the 50-day at 29520. The 200-day lies at 26432 and will be tested at some point.
Russell 2000 mini-index: Currently net short 7k, down 17.7k.
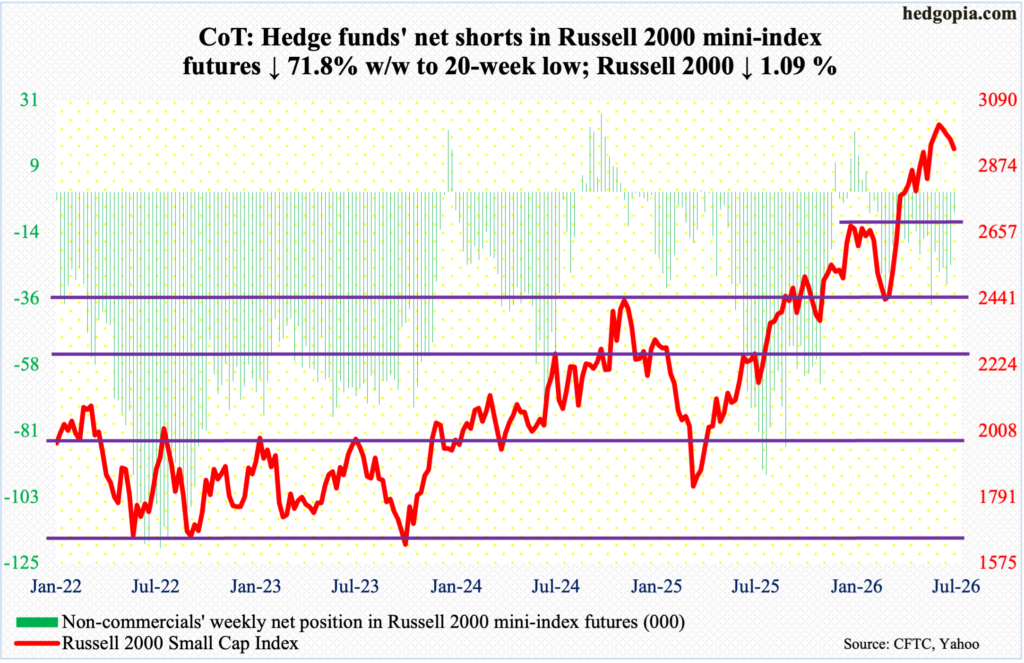
The Russell 2000 rallied sharply from March 30 when it bottomed at 2405, subsequently peaking at 3047 on the 1st this month. Since that high, it has been all downhill, although small-cap bulls are still hanging on to the nearest support.
For the third week running, bulls stepped up in defense of horizontal support at 2940s. This week, the Russell 2000 shed 1.1 percent to 2930, with a weekly low of 2924 posted on Thursday. This support will have been breached once the small cap index decisively breaches the 50-day (2930). The next level to watch then is 2880s, followed by 2720s.
US Dollar Index: Currently net long 15.6k, up 2.4k.
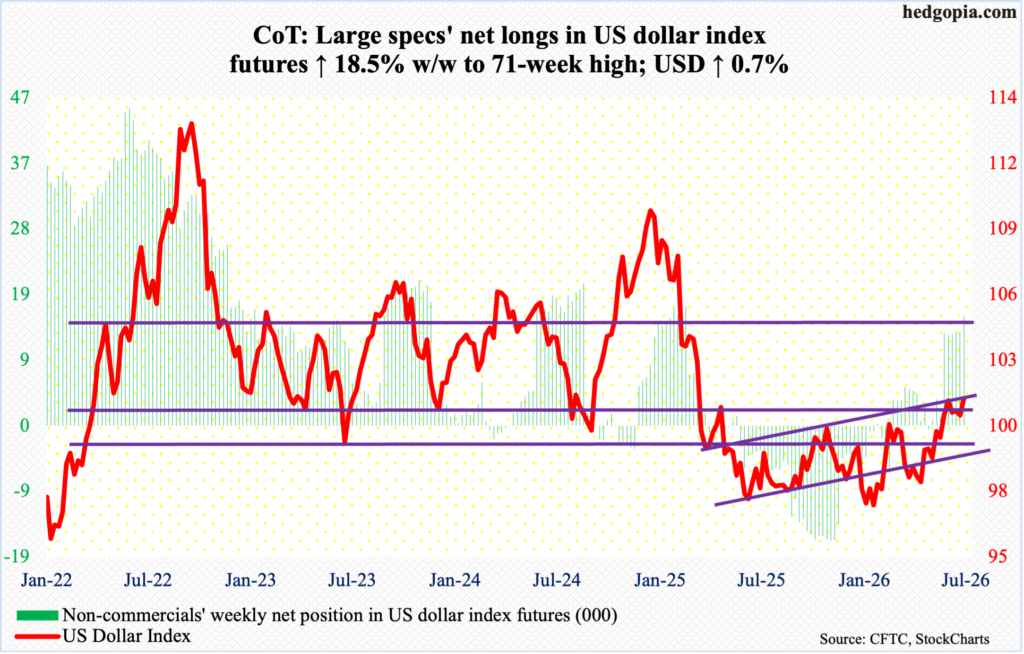
Dollar bulls are not giving up. Buoyed by a sharp rise in long rates, they rallied the US dollar index 0.7 percent to 101.47 this week.
Non-commercials concurrently are convinced the upside momentum will persist as they raised their holdings of net longs to the highest since March last year.
This week, bulls showed up north of 100 as early as Monday, buying the session low 100.65.
The significance of 100 goes back more than a decade, and the level was lost in April last year. More recently, after unsuccessfully trying for five weeks to reclaim the level, including March 31 when an intraday high of 100.64 was hit intraday, longs gave up trying 15 weeks ago. Then, six weeks ago, 100 was reclaimed, followed by a rally to 101.80 by June 24, which is not that far away. Bulls will have scored a major win once they decisively take out last month’s high.
VIX: Currently net short 76.9k, up 11.1k.
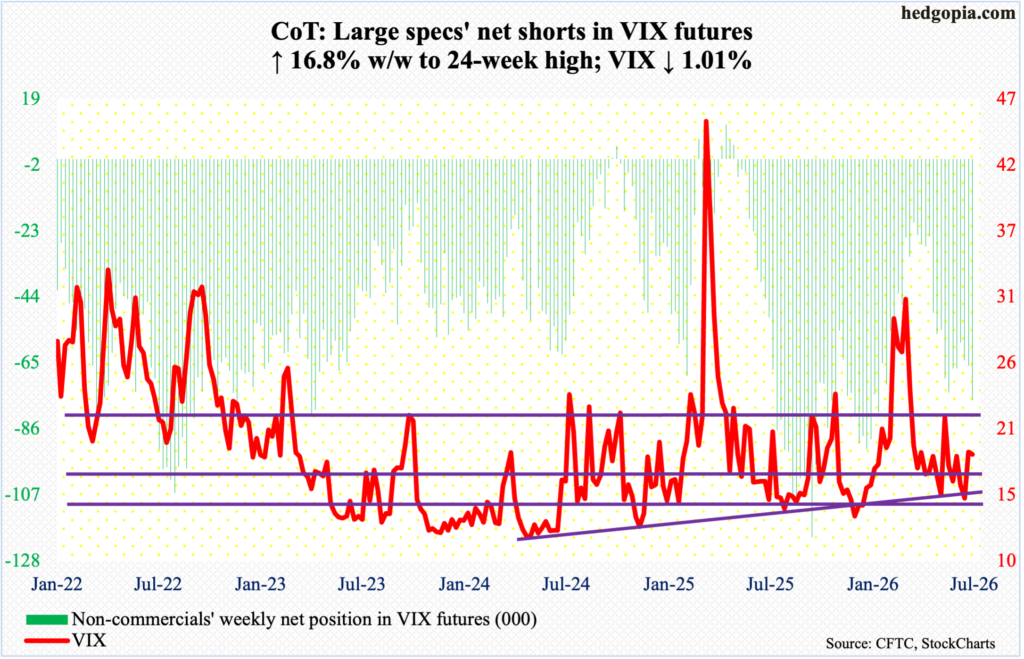
VIX experienced a wide range this week with a high of 20.31 on Thursday and a low of 16.64 on Wednesday, before settling at 18.58, down 0.19 point, for a weekly spinning top. The volatility index is trapped between the 200- and 50-day (18.71 and 17.37 respectively); the latter was defended in the final two sessions this week.
VIX has plenty of room to run higher on the weekly, and for that to materialize, positive momentum needs to fare better; the weekly RSI (50.08) finished the week right at the median and can rally to the high-50s to low-60s in the right circumstances.
Thanks for reading!
Comments
Log in or sign up to join the conversation.