

Up, up and away. But that’s been true in the past too.
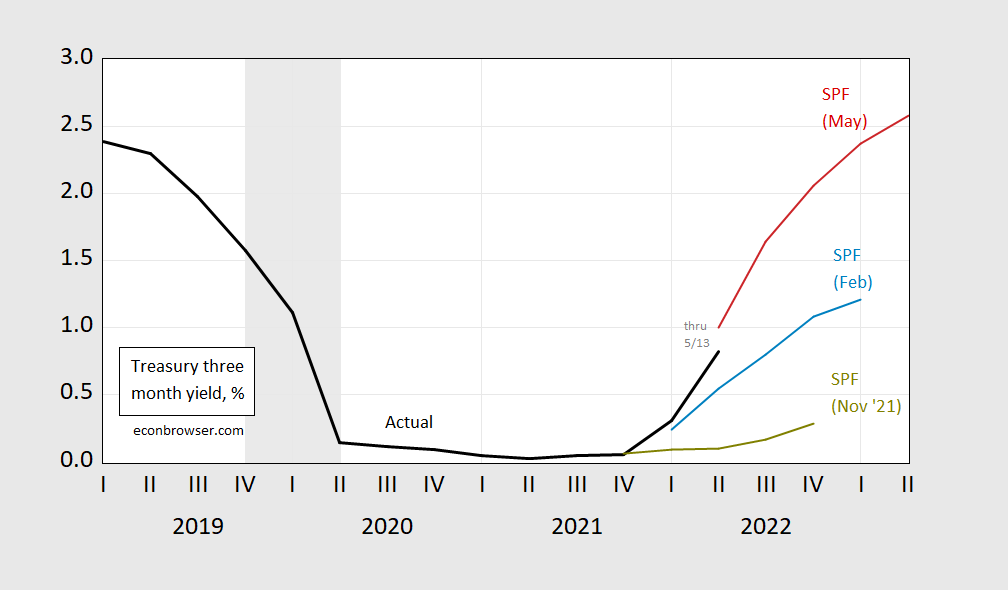
Figure 1: Treasury three month yields on secondary market (black), November 2021 Survey of Professional Forecasters media (chartreuse), February 2022 (blue), May 2022 (red). NBER defined recession dates peak-to-trough shaded gray. Source: Treasury via FRED, SPF, NBER.
Here’s the historical record for economists forecasting the 3-month yield, discussed in this post.
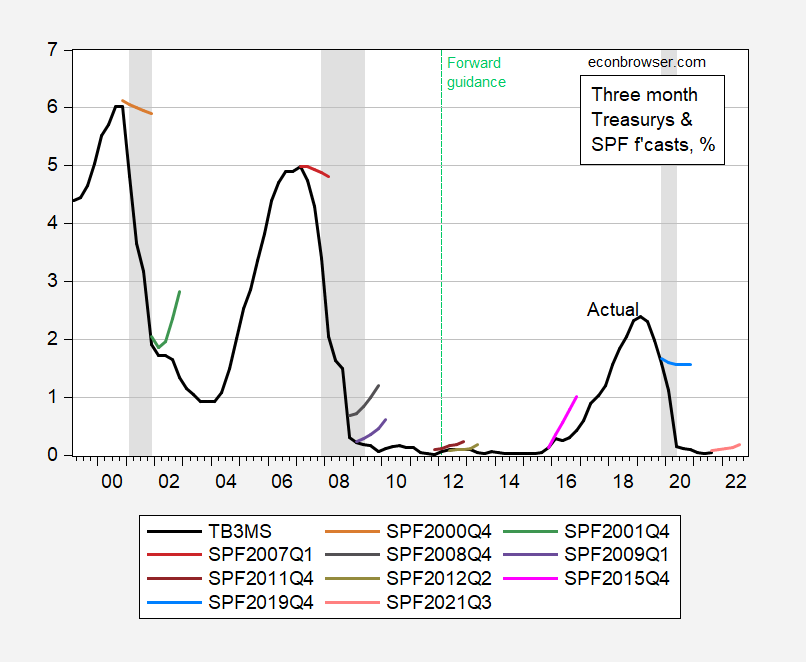
Figure 2: Three month Treasury yields on secondary market, monthly average of daily data (black), Survey of Professional Forecasters mean forecasts from indicated quarters. NBER recession dates shaded gray. Source: Federal Reserve and Philadelphia Fed Survey of Professional Forecasters, and NBER.
The difference between the current episode and the previous is that inflation is substantially higher (although the real natural rate is probably lower).
One interesting implication of these forecasts is that the 10yr-3mo spread is shrinking faster in the May survey vs. the February survey (you can see the evolving path for the 10 year in this post).
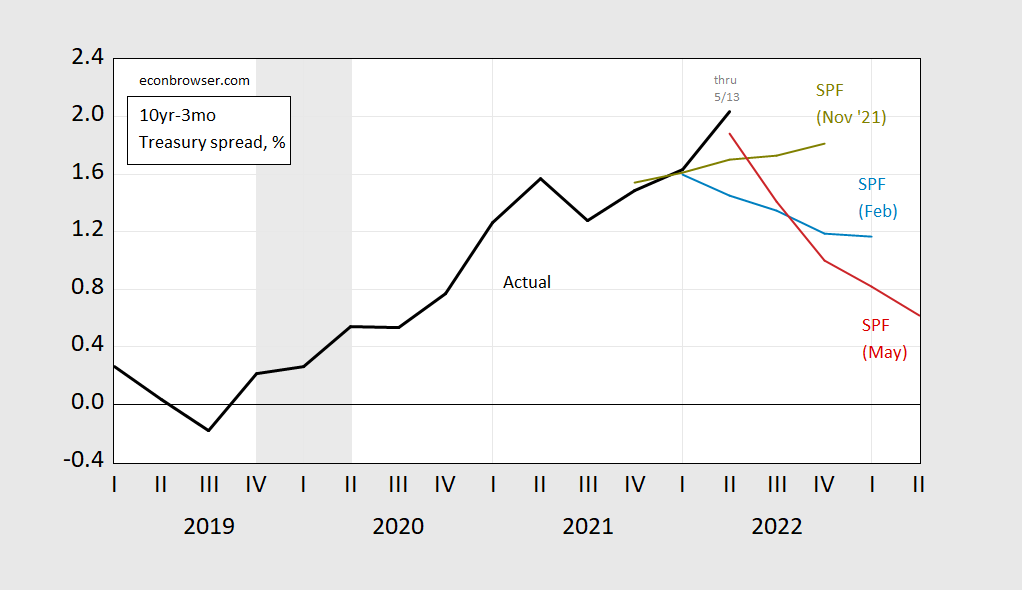
Figure 3: Treasury ten year – three month spread (black), November 2021 Survey of Professional Forecasters media (chartreuse), February 2022 (blue), May 2022 (red). NBER defined recession dates peak-to-trough shaded gray. Source: Treasury via FRED, SPF, NBER.



Comments
Log in or sign up to join the conversation.