
We are 13 sessions into the beta phase decline of the short-term cycle that began on February 3. A cycle low setup occurred on March 18, suggesting that the latest short-term cycle low (STCL) could form at any time. A close above 2,437 on the S&P 500 index during the next session would generate a cycle low signal and indicate that the next short-term cycle is likely in progress.
(Click on image to enlarge)
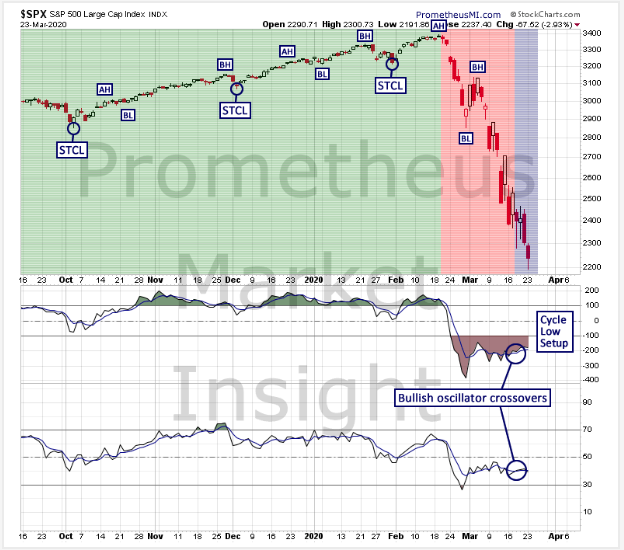
The magnitude and duration of the current beta phase decline reconfirm the current bearish short-term trend and favor additional short-term weakness.
S&P 500 Index Daily Chart Analyses
The following technical and cycle analyses provide short-term forecasts for the S&P 500 index.
Technical Analysis
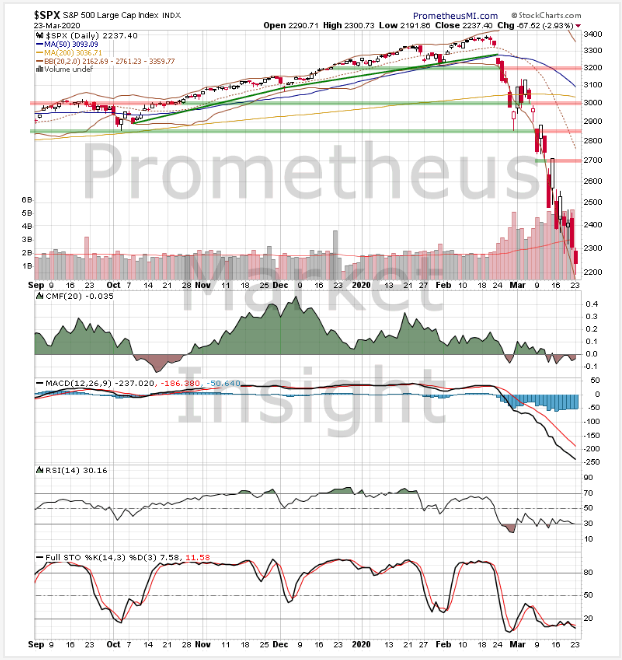
The index closed sharply lower today, moving down to a new low for the violent downtrend from February. Technical indicators are extremely bearish overall, strongly favoring a continuation of the decline.
(Click on image to enlarge)
Cycle Analysis
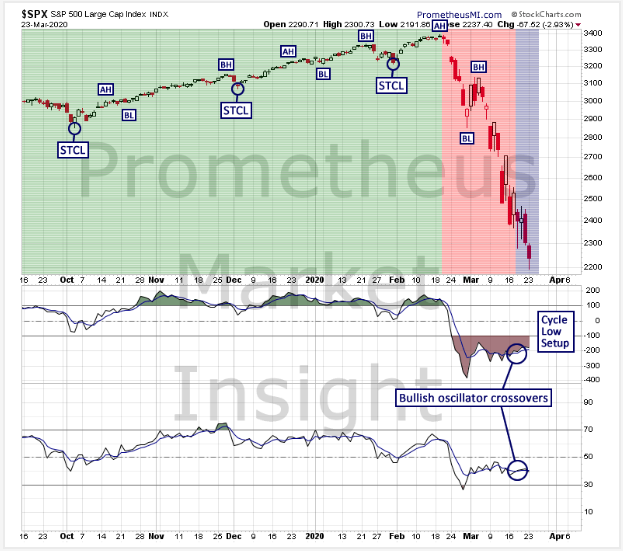
We are 13 sessions into the beta phase decline of the cycle following the short-term cycle low (STCL) on January 31. A cycle low setup occurred on March 18, suggesting that the latest STCL could form at any time. A close above 2,437 during the next session would generate a cycle low signal and indicate that the next cycle is likely in progress. The magnitude and duration of the current beta phase decline reconfirm the bearish translation and favor additional short-term weakness. The window during which the next STCL is likely to occur is now through April 2, with our best estimate being now through March 25.
- Last STCL: January 31, 2020
- Cycle Duration: 35 sessions
- Cycle Translation: Bearish
- Next STCL Window: Now through April 2; best estimate now through March 25.
- Setup Status: Cycle low setup occurred on March 18.
- Trigger Status: Cycle low trigger is pending from March 18, requiring a close above 2,437 during the next session to generate a cycle low signal.
- Signal Status: No active signals.
- Stop Level: None active.
(Click on image to enlarge)
Short-term Outlook
- Bullish Scenario: A rebound and close well above the recent short-term high at 2,437 would predict a move up toward the middle of the Bollinger bands at 2,761.
- Bearish Scenario: A close below current levels would reconfirm the downtrend from February and forecast additional losses.
Both scenarios are equally likely.
Comments
Log in or sign up to join the conversation.