
We are 6 sessions into the beta phase rally of the short-term cycle that began on August 20. The beta high (BH) of the current cycle may have formed on September 16, although we would need to see additional weakness to confirm that development.
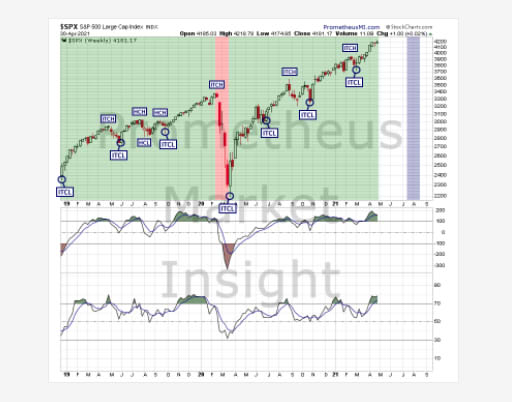
(Click on image to enlarge)
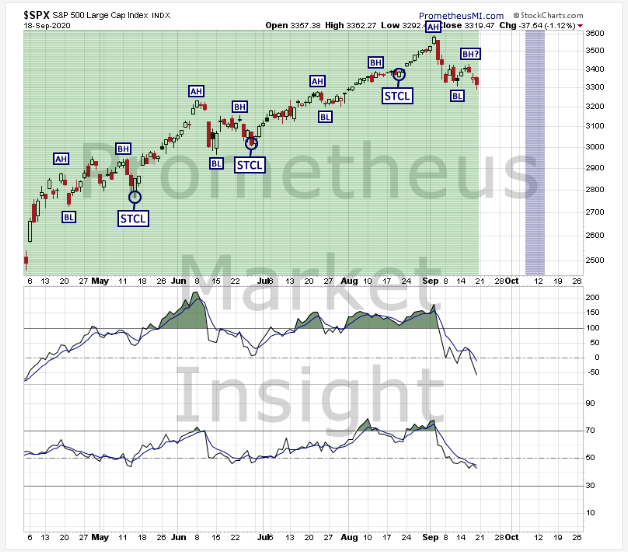
An extended beta phase rally that moves up to new highs would reconfirm the current bullish short-term trend and forecast additional gains. Alternatively, a quick reversal followed by an extended beta phase decline that moves well below the last short-term low at 3,310 would signal the likely transition to a bearish short-term trend.
S&P 500 Index Daily Chart Analyses
The following technical and cycle analyses provide short-term forecasts for the S&P 500 index.
Technical Analysis
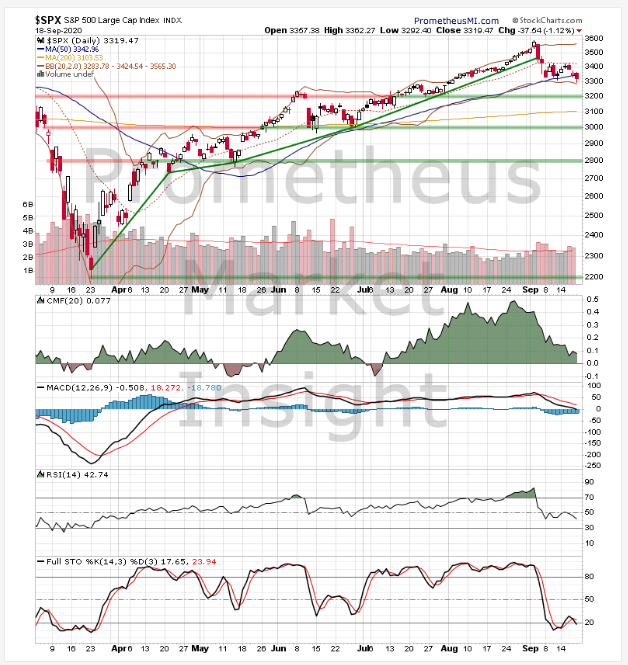
The index closed sharply lower today, moving down to a new short-term low below previous highs of the uptrend from March. Technical indicators are slightly bearish overall, tentatively favoring a continuation of the decline from early September.
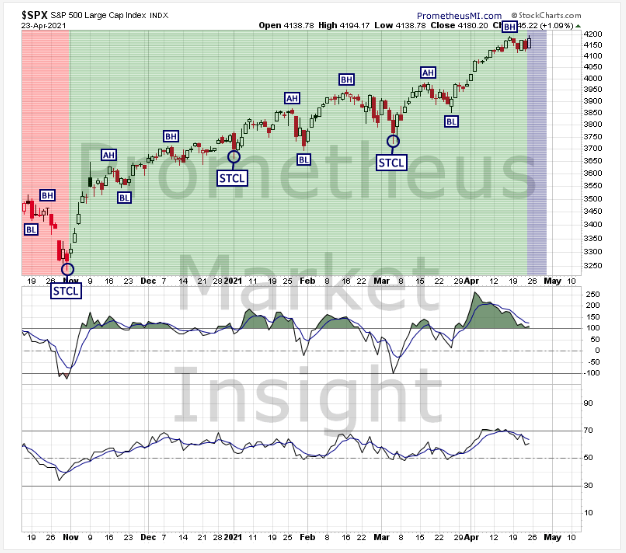
(Click on image to enlarge)
Cycle Analysis
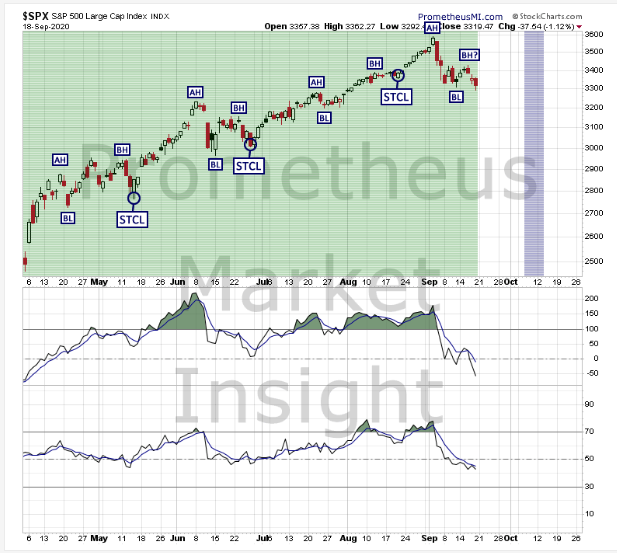
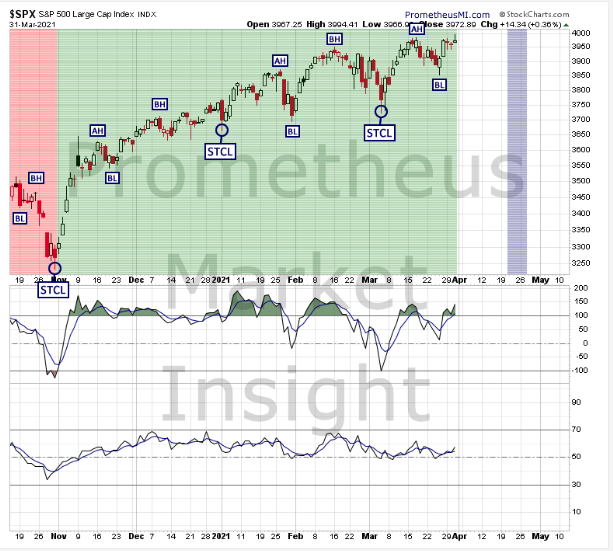
We are 6 sessions into the beta phase rally of the cycle following the short-term cycle low (STCL) on August 20. The beta high (BH) of the current cycle may have formed on September 16, although we would need to see additional weakness to confirm that development. An extended beta phase rally that moves up to new highs would reconfirm the current bullish translation and forecast additional gains. Alternatively, a quick reversal followed by an extended beta phase decline that moves well below the last BL at 3,310 would signal the likely transition to a bearish translation. The window during which the next STCL is likely to occur is from September 30 to October 20, with our best estimate being in the October 7 to October 13 range.
- Last STCL: August 20, 2020
- Cycle Duration: 21 sessions
- Cycle Translation: Bullish
- Next STCL Window: September 30 to October 20; best estimate in the October 7 to October 13 range.
- Setup Status: No active setups.
- Trigger Status: No pending triggers.
- Signal Status: No active signals.
- Stop Level: None active.
(Click on image to enlarge)
Short-term Outlook
- Bullish Scenario: A rebound and close well above the middle of the Bollinger bands at 3,425 would predict a return to the previous short-term high at 3,581.
- Bearish Scenario: A close well below the 50-day moving average at 3,343 would reconfirm the downtrend from early September and forecast additional losses.
The bearish scenario is slightly more likely (~60 probable).
Comments
Log in or sign up to join the conversation.