
Shopify Inc., Elliott Wave Technical Analysis
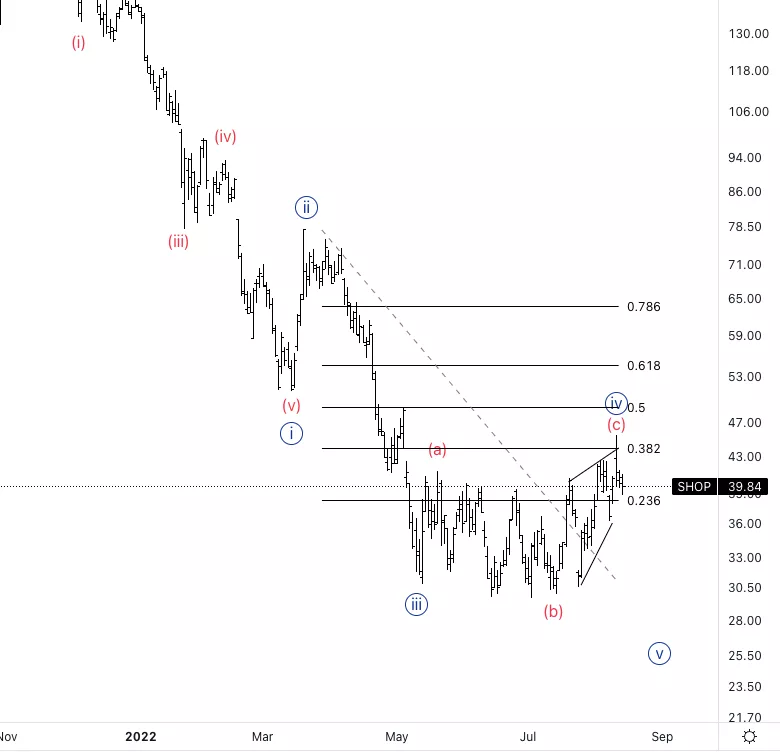
Shopify Inc., (SHOP): Daily Chart, August 16, 2022,
SHOPStock Market Analysis: Looking for continuation lower into wave {v}. Potential wave {iv} is taking quite some time which could have been predicted due to the fact that wave {ii} was a sharp correction therefore because of the rule of alternation wave {iv} had to be time consuming.
SHOP Elliott Wave count: Wave (c of {iv}.
SHOPTrading Strategy: Waiting for further confirmation to start building shorts. We need to break wave iv of (c.
SHOPTechnical Indicators:We are well below the 200 EMA and we are starting to form RSI bearish divergence.
SHOPLatest News: Shopify Inc. (SHOP) is Attracting Investor Attention: Here is What You Should Know(Zacks Equity Research)
TradingLounge Analyst: Alessio Barretta
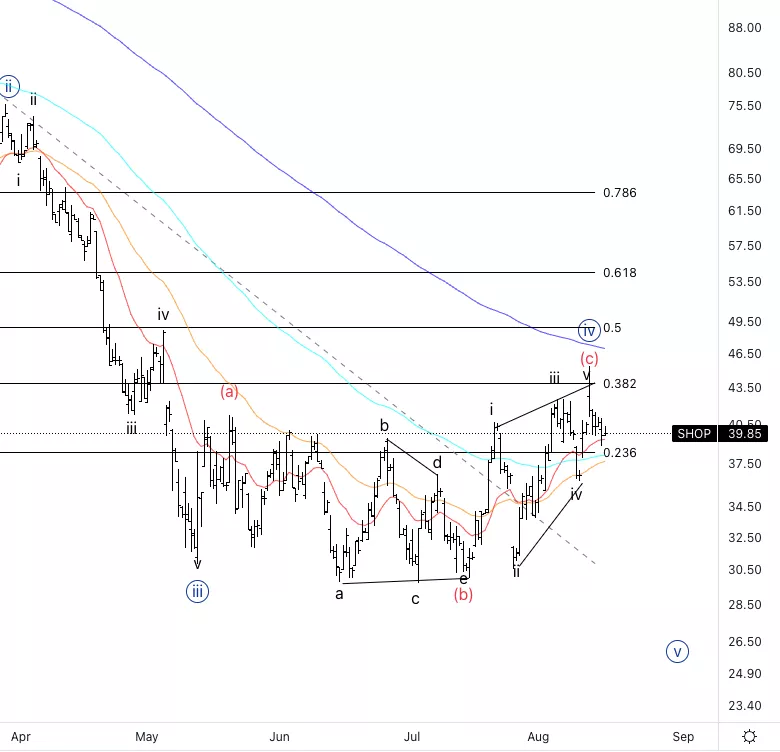
ShopifyInc., SHOP: 4-hour Chart, August 16 2022,
Shopify Inc., Elliott Wave Technical Analysis
SHOP Stock Market Analysis: Looking for further downside to start wave (i) of {v}.
SHOPElliott Wave count: Wave (i) of {v}.
SHOP Technical Indicators: We barely touched the 200 EMa and found resistance from it. Looking for a break and a retest of the 20 EMA( red line).
SHOPTrading Strategy: Waiting for additional confirmation i.e. the break of wave iv of c) .
More By This Author:
Dogecoin Elliott Wave Analysis - Aug. 16
Elliott Wave Technical Analysis: Intuitive Surgical, Inc.
Elliott Wave Price Prediction: Bitcoin


Comments
Log in or sign up to join the conversation.