
U.S. consumer spending rose 0.5 percent in September. What does it imply for the gold market?
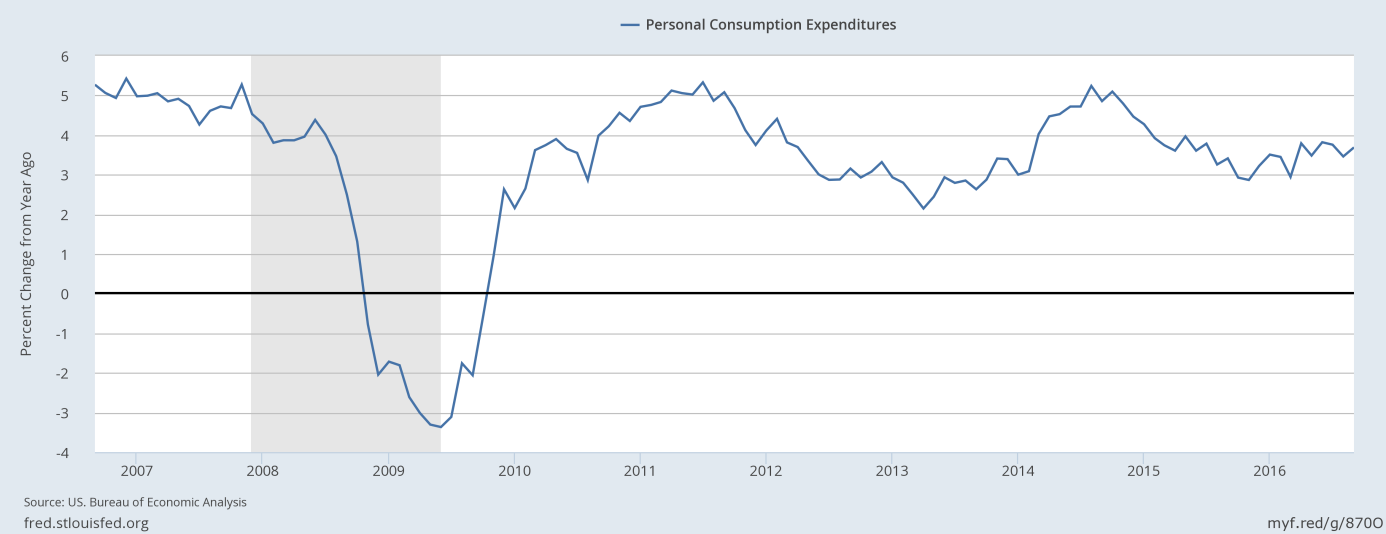
Personal consumption expenditures increased 0.5 percent last month after a 0.1 percent decline in August. The jump was in line with expectations and it was the biggest since June. The increase was driven by a 1.3 percent surge in purchases of durable goods (such as motor vehicles). On an annual basis, consumer spending rose 3.7 percent and remained relatively strong, as one can see in the chart below. However, in the third quarter of 2016, consumer spending grew just 2.1 percent, after a 4.3 percent advance in the prior period.
Chart 1: Personal consumption expenditures from 2006 to 2016 (as percent change from year ago).
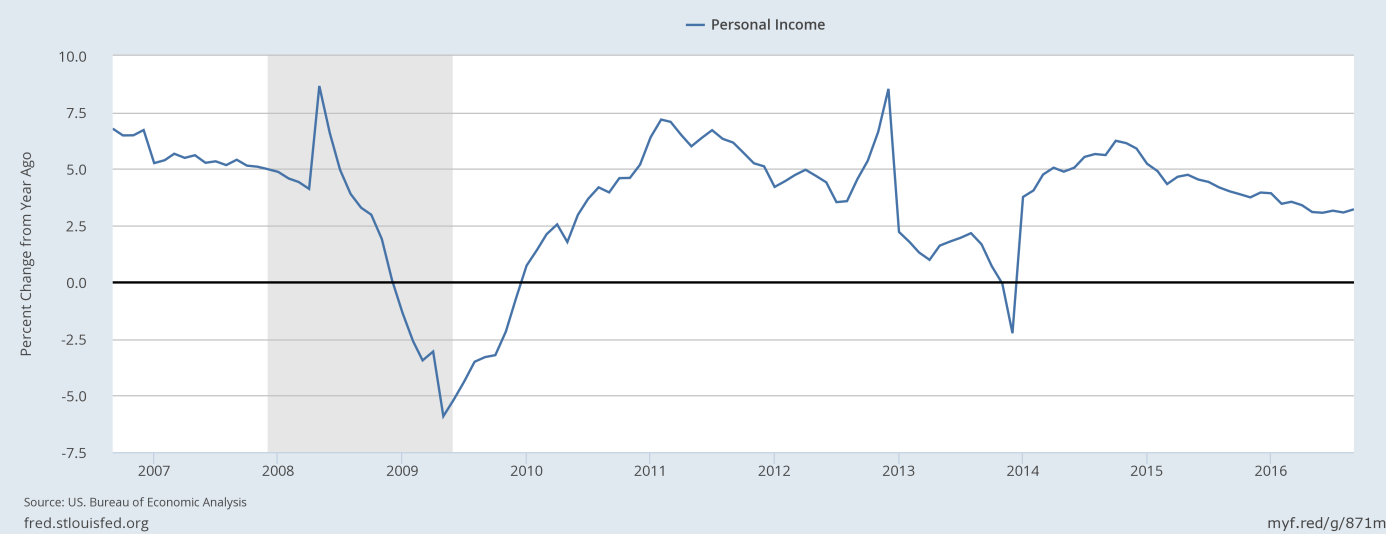
Solid consumer spending was partially possible by a gradual rise in incomes. Personal incomes jumped 0.3 percent in September, following a 0.2 percent increase in August. Importantly, wages and salaries rose in line with overall personal incomes. However, on an annual basis, the pace of growth has slowed down in the last year, as one can see in the chart below.
Chart 2: Personal income over the last 5 years (as percent change from year ago).
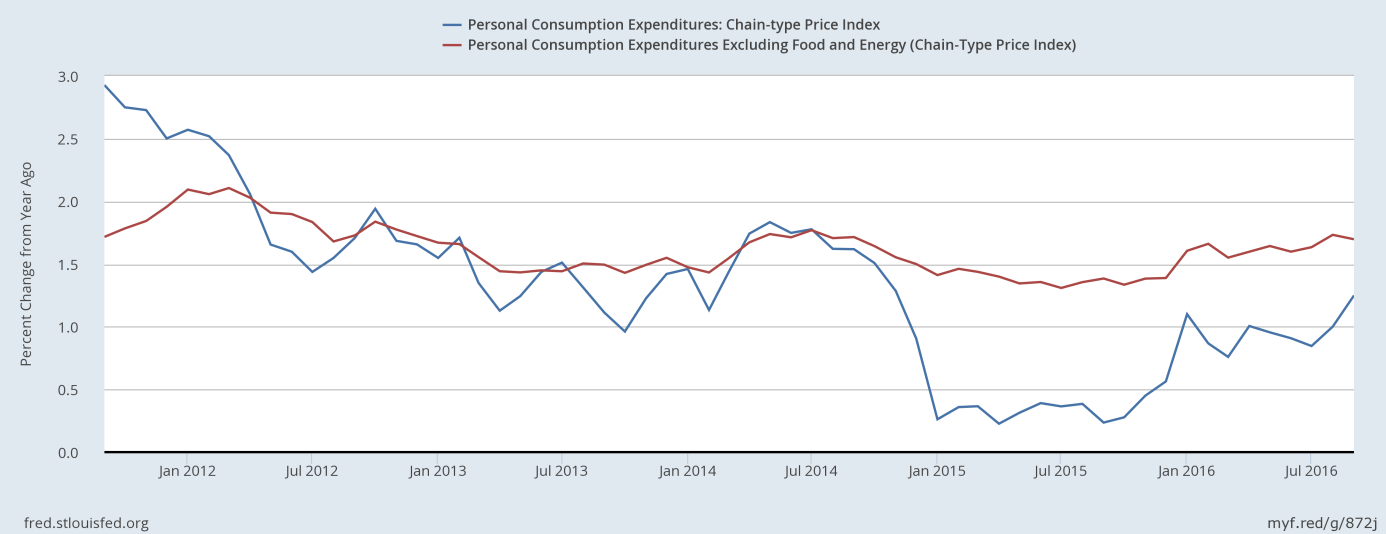
The increased expenditures pushed up the rate of inflation. The PCE price index rose 0.2 percent, after the same increase in August, while its core version edged up 0.1 percent after a 0.2 percent rise in the previous month. On an annual basis, the PCE price index increased 1.2 percent, the fastest pace in nearly two years. Although the inflation rate is still below the Fed’s target, such acceleration could strengthen the camp of hawks within the U.S. central bank, which should not be positive for the gold market. The core index excluding food and energy prices rose 1.7 percent, at the same pace as in the previous month. Generally speaking, inflationary pressures increased in September slightly, as one can see in the chart below.
Chart 3: PCE Price Index (blue line) and Core PCE Price Index (red line) as percent change from year ago, from 2011 to 2016.
The bottom line is that the September personal income and outlays report was solid, but it should not significantly move the markets as the spending figures had already been incorporated into last Friday’s report on the GDP growth in the third quarter of this year. Indeed, it was practically a non-event for the yellow metal. However, the report may be negative for the gold market as rising inflation should strengthen the case for the Fed interest rate hike in December. The market odds of such a move increased from 74 percent to almost 78 percent. Although the hawkish move is unlikely at the November FOMC meeting this week, the Fed may signal a hike next month. Therefore, gold may be submitted to downward pressure in the near future, unless the election results surprise the markets.

Comments
Log in or sign up to join the conversation.