

According to the BLS, the Consumer Price Index (CPI-U) year-over-year inflation rate was 2.2 % - growing from than last month's 1.9 %. The year-over-year core inflation (excludes energy and food) rate was again unchanged 1.7 %, and is below the target set by the Federal Reserve.

Analyst Opinion of the Consumer Price Index
Energy was the driver for the increase in inflation - and maybe much of the blame goes to the hurricanes. Core inflation remain below 2 % year-over-year
The market expected (from Bloomberg / Econoday):
| Consensus Range | Consensus | Actual | |
| CPI-U - month-over-month (MoM) | 0.3 % to 0.7 % | +0.6 % | +0.5% |
| CPI-U year-over-year (YoY) | 2.0 % to 2.4 % | +2.3 % | +2.2 % |
| CPI less food & energy (MoM) | 0.1 % to 0.3 % | +0.2 % | +0.1 % |
| CPI less food & energy (YoY) | 1.7 % to 1.8 % | +1.8 % | +1.7 % |

As a generalization - inflation accelerates as the economy heats up, while inflation rate falling could be an indicator that the economy is cooling. However, inflation does not correlate well to the economy - and cannot be used as a economic indicator.
The major influence on the CPI was again energy prices.
The Consumer Price Index for All Urban Consumers (CPI-U) rose 0.5 percent in September on a seasonally adjusted basis, the U.S. Bureau of Labor Statistics reported today. Over the last 12 months, the all items index rose 2.2 percent.
The gasoline index increased 13.1 percent in September and accounted for about three-fourths of the seasonally adjusted all items increase. Other major energy component indexes were mixed, and the food index rose slightly.
The index for all items less food and energy increased 0.1 percent in September. The shelter index continued to increase, and the indexes for motor vehicle insurance, recreation, education, and wireless telephone services also rose. These increases more than offset declines in the indexes for new vehicles, household furnishings and operations, medical care, and used cars and trucks.
The all items index rose 2.2 percent for the 12 months ending September; the 12-month change has been accelerating since it was 1.6 percent in June. The 12-month change in the index for all items less food and energy remained at 1.7 percent for the fifth month in a row. The energy index rose 10.1 percent over the past 12 months, its largest 12-month increase since the period ending March 2017. The food index increased 1.2 percent over the last year.
Historically, the CPI-U general index tends to correlate over time with the CPI-U's food index. The current situation is putting an upward pressure on the CPI.
CPI-U Index compared to the Food sub-Index of CPI-U

Notice the gap in the above graphic between the CPI and Food - historically this gap has always closed when the knock-on effect from higher food prices into other CPI components moderates.
Recently, medical care too has been accelerating faster than costs in general. The graphs below compare health care to the CPI-U. Note that the rate of growth of healthcare costs is now at the levels seen prior to the introduction of Obamacare.
Month-over-Month Change CPI-U Index (red line) compared to the Medical Care sub-Index of CPI-U (blue line)

Year-over-Year Change CPI-U Index (red line) compared to the Medical Care sub-Index of CPI-U (blue line)

The Federal Reserve has argued that energy inflation automatically slows the economy without having to intervene with its monetary policy tools. This is the primary reason the Fed wants to exclude energy from analysis of consumer price increases (the inflation rate).

In the above chart - the green boxes are significant elements moderating inflation, while the red boxed items are significant elements fueling inflation.
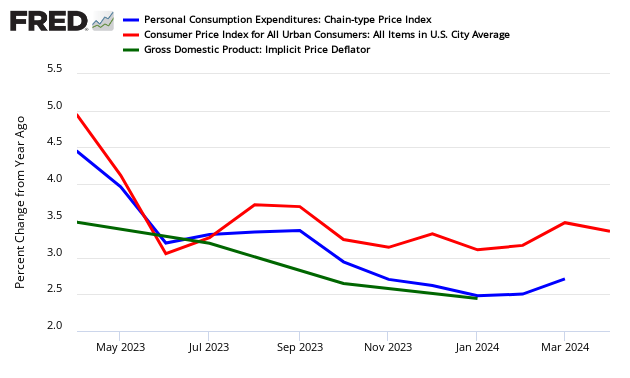
The graph below looks at the different price changes seen by the BEA in this PCE release versus the BEA's GDP and BLS' Consumer Price Index (CPI).
Year-over-Year Change - PCE's Price Index (blue line) versus CPI-U (red line) versus GDP Deflator (green line)
Caveats on the Use of the Consumer Price Index
Econintersect has performed several tests on this series and finds it fairly representative of price changes (inflation). However, the headline rate is an average - and will not correspond to the price changes seen by any specific person or on a particular subject.
Although the CPI represents the costs of some mythical person. Each of us need to provide a multiplier to the BLS numbers to make this index representative of our individual situation. This mythical person envisioned spending pattern would be approximately:

The average Joe Sixpack budgets to spend his entire paycheck or retirement income - so even small changes have a large impact to a budget.
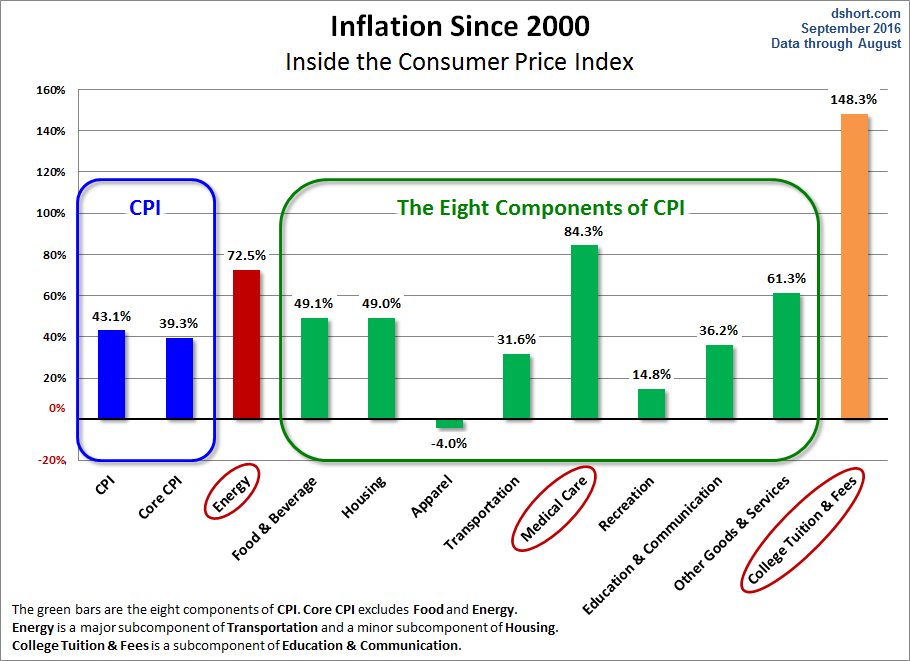
The graph above demonstrates that fuel costs, medical care, and school costs are increasing at a much faster pace than the headline CPI-U.
The Bureau of Labor Statistics (BLS) has compiled CPI data since 1913, and numbers are conveniently available from the FRED repository (here). Long-term inflation charts reach back to 1872 by adding Warren and Pearson's price index for the earlier years. The spliced series is available at Yale Professor (and Nobel laureate) Robert Shiller's website. This look further back into the past dramatically illustrates the extreme oscillation between inflation and deflation during the first 70 years of our timeline. Click here for additional perspectives on inflation and the shrinking value of the dollar.

Because of the nuances in determining the month-over-month index values, the year-over-year or annual change in the Consumer Price Index is preferred for comparisons.


Comments
Log in or sign up to join the conversation.