

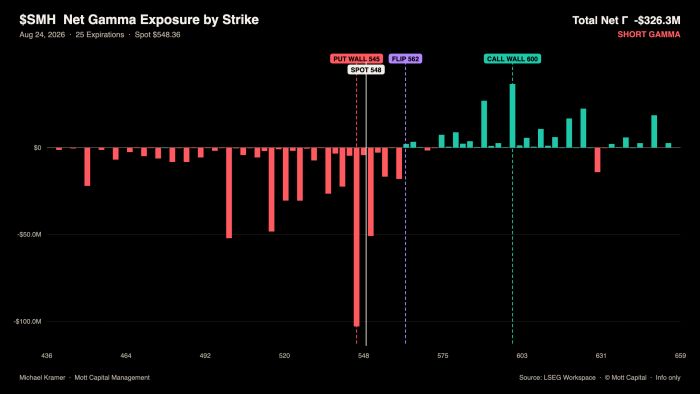
The S&P 500 finished the day lower, with semiconductor stocks leading the way. The SMH ETF bounced off the put wall today, which had moved down to $545. I just do not know how long that level will hold. There appears to be a decent amount of gamma built up there, and much will depend on how quickly it can be eroded. Tomorrow may give us better insight into that.
But clearly, with the sector in negative gamma, a break of support at $545 could accelerate a downside move toward $500. However, ahead of Nvidia (NVDA), that may be a big task, so a few more days of churning seem possible.
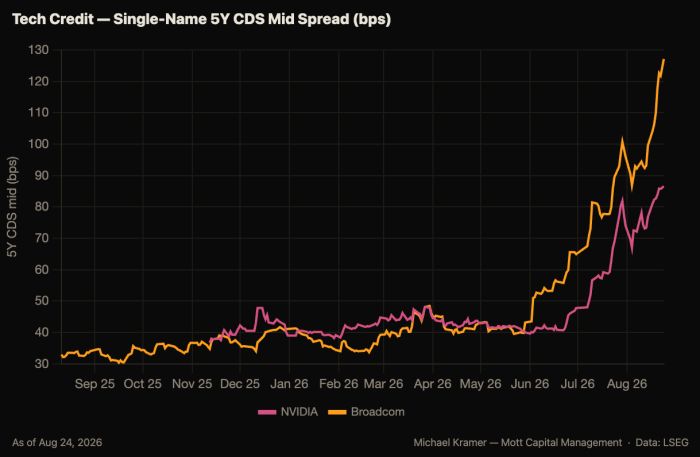
For the most part, the semis are the key to the S&P 500 at this point, and it will be difficult to see the market rally at the index level if the semis are falling. The credit market continues to signal greater risk in the semis, with Broadcom (AVGO) and Nvidia’s CDS widening today. I find it hard to imagine Nvidia and Broadcom’s CDS widening like this while the sector rallies, but stranger things have been known to happen.
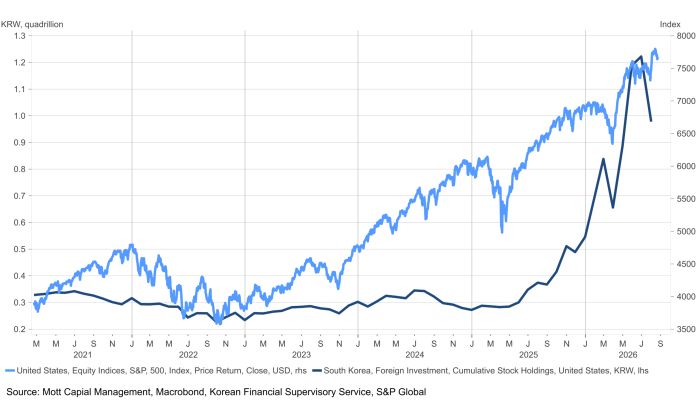
Recent data show that Korean inflows have turned to outflows, and the stronger KRW is likely linked to some of that liquidity in semiconductors leaving the U.S. More importantly, the inflow and outflow data are denominated in KRW, so we know the decline wasn’t simply due to the KRW strengthening against the U.S. dollar.
Finally, the VIX1D is very low, below 10, and is unlikely to remain there, given that Nvidia reports Wednesday after the close and Warsh speaks at Jackson Hole on Friday morning. I would expect to see the VIX1D move up toward 20-ish ahead of both events. Whether that increase in implied volatility leads to a market sell-off will depend on whether the VIX rises in tandem.
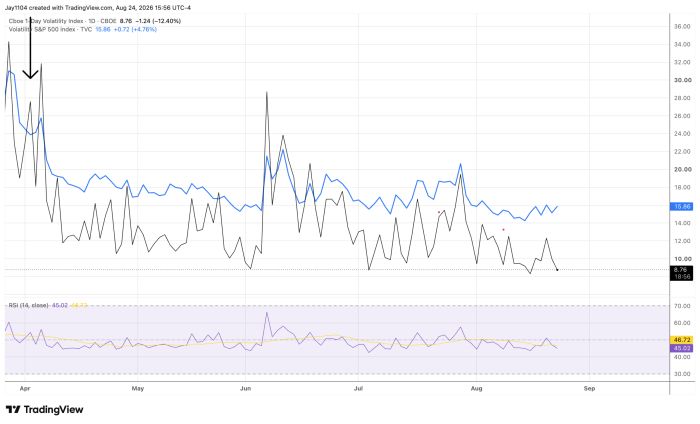
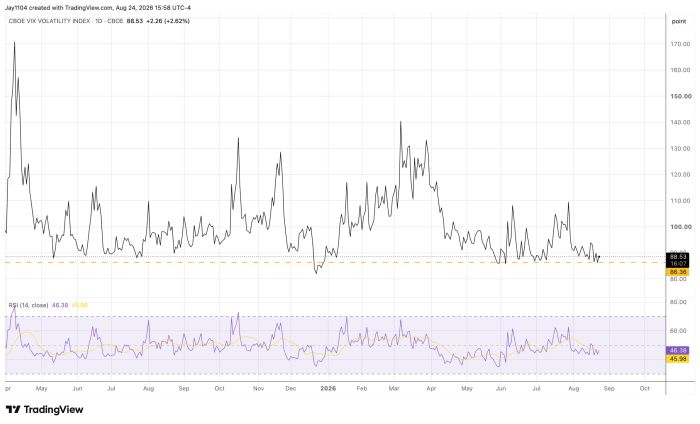
Maybe that is why the VVIX was up a touch today, but more importantly, it has been firm at 86 since the end of May.



Comments
Log in or sign up to join the conversation.