

Working from the following simple model below, the Norwegian krone should be trading much better against the euro:
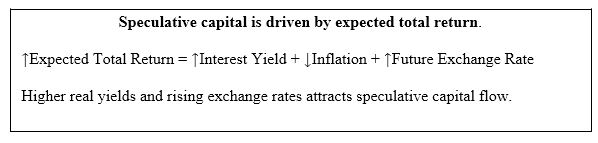
Assume we cannot forecast the future exchange rate in the equation, it leaves us with nominal interest rates and inflation to work with (but nominal interest rates and inflation are all wrapped up in the same feedback loop with expected economic growth); therefore we simplify for this purpose

Thus, the real yield available from Norwegian 2-year paper is 0.61% (or 61 basis points) greater than owning 2-year Eurozone paper. Given that, theoretically, speculative capital should be flowing to Norway in greater relative proportion, from hot money investors, than what is flowing into the Eurozone. In a world of zero bound interest rates, a 61 basis point pickup on relatively short-term paper is a big deal.
But theory and reality are two different things of course.
Despite economists tidy exclamations of ceteris paribus (roughly translated as other conditions remaining the same), in the real world of pseudo free market prices, all relationships which are embodied by said prices are continuously fluctuating; conditions never remain the same. To add to complexity, there are continuous feedback loops everywhere (von Mises taught us that). So, we make forecasts (dressed up guesses); but we must understand our guesses, and those of others, impact future prices, which in turn engenders updated forecasts, into infinitum really [see Reflexivity]. I hope that made a modicum of sense.
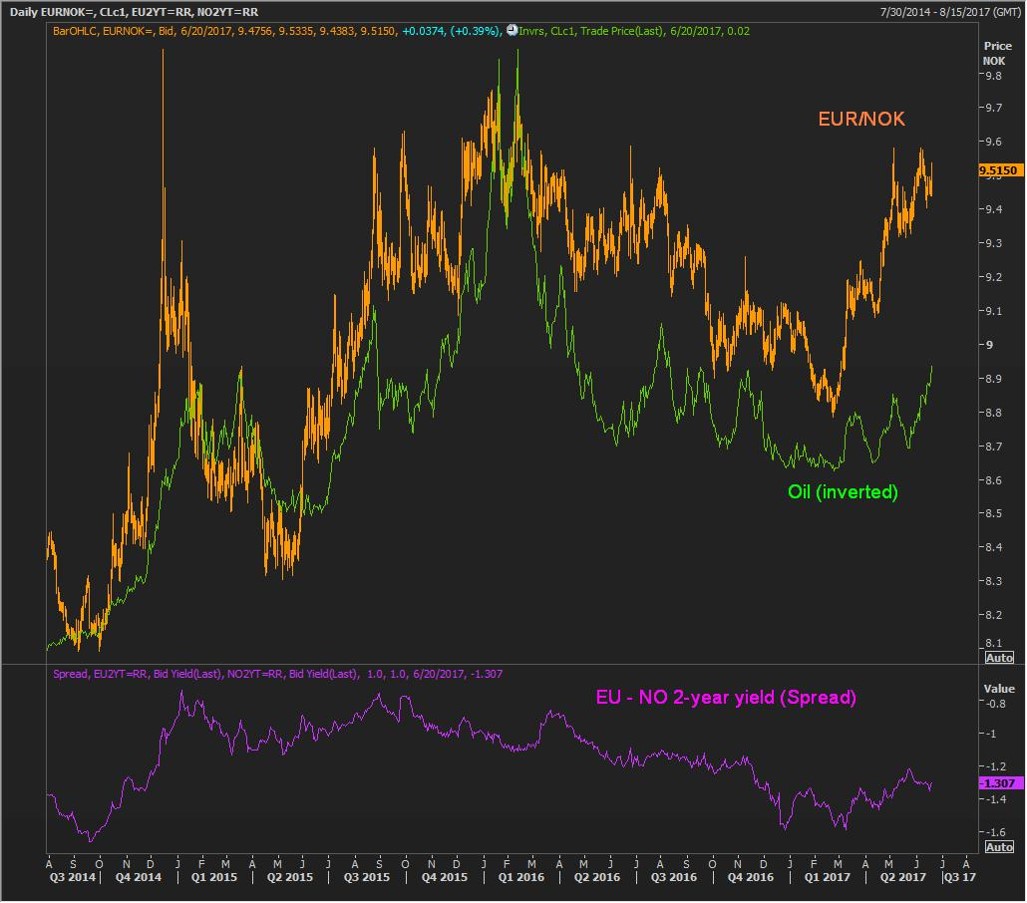
In the graphic on page 3 it shows the price action of three different variables overlaid: EUR/NOK, oil, and the Eurozone-Norway 2-year interest rate spread. And despite the importance of yield spread on relative currency prices, the biggest driver in EUR/NOK relationship seems to be oil. It makes sense, given the huge component to Norway’s economy; lower oil prices should mute growth expectations.
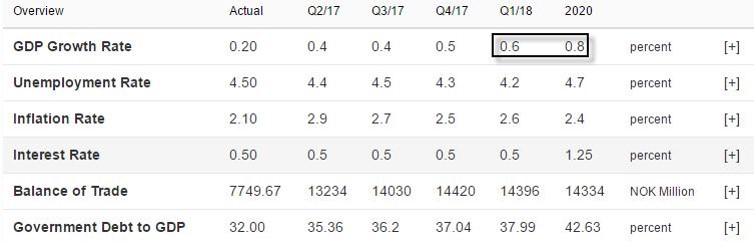
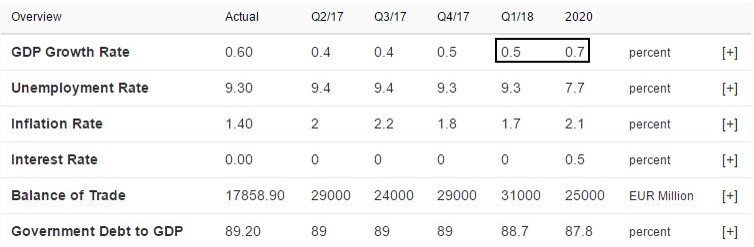
However, according to Trading Markets growth expectations for Q3 and Q4 2017 are the same for Norway and the Eurozone. And in fact, Q1 and Q2 for 2018 are higher for Norway (as you can see in the chart below).
Norway
Eurozone
EUR/NOK (gold) vs. Oil Inverted (green) vs. 2-yr Yield Spread (purple) Daily: As you can see, despite yield and growth, the tighter correlation between EUR/NOK is oil; i.e. as oil prices fall (green line going higher in this chart) EUR/NOK goes higher (or put another way, the Norwegian krone weakens relative to the euro).
(Click on image to enlarge)


Comments
Log in or sign up to join the conversation.