

Good Monday morning and welcome back. Global markets appear to be in sigh of relief mode this morning in response to the preliminary round of the French election. Pro-growth, pro-EU, centrist candidate Emmanuel Macron emerged as the early leader as both of France’s establishment parties were eliminated in the first round of voting. Macron will face far-right nationalist Marine Le Pen in the May 7 runoff election. But with Macron taking the early lead in the polls, the hope is that stability in the EU and growth for France will become the themes of the day.
Now let’s move on to an objective review the key market models and indicators. The primary goal of this exercise is to remove any preconceived, subjective notions about the markets and ensure that we stay in line with what “is” really happening in the market. So, let’s get started…
The State of the Trend
We start each week with a look at the “state of the trend.” These indicators are designed to give us a feel for the overall health of the current short- and intermediate-term trend models.
(Click on image to enlarge)
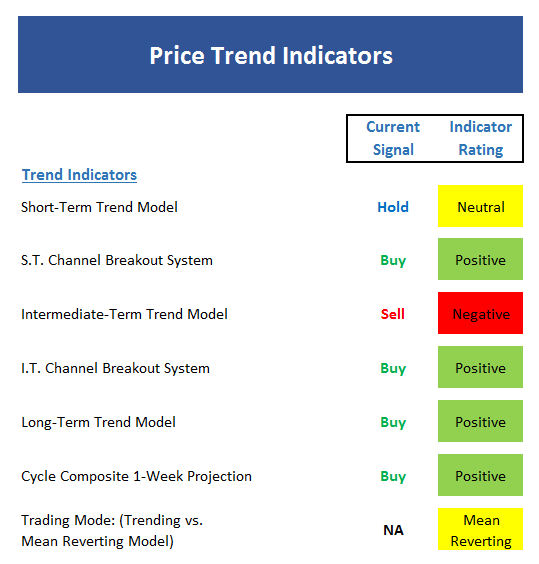
Executive Summary:
- The short-term Trend Model reflects the sideways range that has developed over the past month
- The short-term Channel Breakout System remains on a buy signal – a break below 2320 would cause the signal to reverse
- The intermediate-term Trend Model remains negative, albeit by a slim margin
- The intermediate-term Channel Breakout System is also on a buy signal and employs the same breakdown point as the s.t. system
- The long-term Trend Model is still solidly positive
- The Cycle Composite points higher for the next couple weeks
- The Trading Mode models confirm this to be a trendless environment at this time. As such, a “ride the range” trading approach is most appropriate for short-term traders
The State of Internal Momentum
Next up are the momentum indicators, which are designed to tell us whether there is any “oomph” behind the current trend…
(Click on image to enlarge)
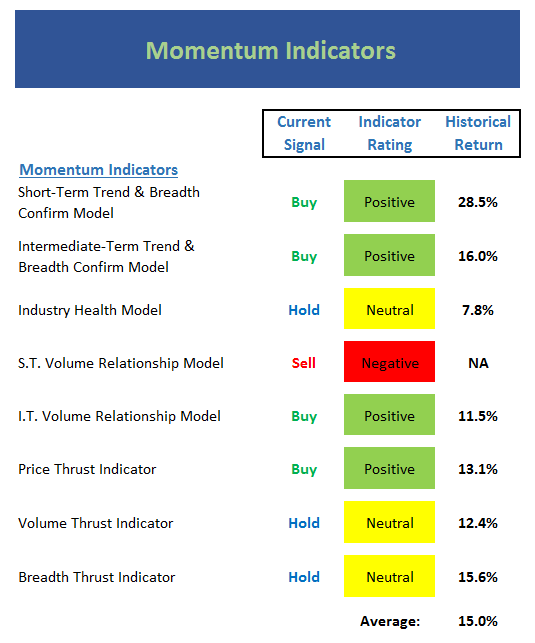
Executive Summary:
- Our short-term Trend and Breadth Confirm Model flipped to positive last week, but only by the slimmest of margins
- Ditto for the intermediate-term Trend and Breadth Confirm Model
- The Industry Health Model is going nowhere fast and stuck in the neutral zone. This model has done a good job of helping us avoid becoming overexuberant at the end of February
- The short-term Volume Relationship remains negative but is showing signs of improvement
- The intermediate-term Volume Relationship indicator is very slow moving and remains positive
- The Price Thrust Indicator managed to peak its head up into the positive zone, but, as has been the theme so far this week, not by much
- The Volume Thrust Indicator has moved out of the red zone and into a mode where stocks can gain ground
- The Breadth Thrust Indicator also improved to neutral – where stocks have actually done well since 1980
- In sum, the momentum board is no longer negative – but some of the green is a bit misleading
The State of the “Trade”
We also focus each week on the “early warning” board, which is designed to indicate when traders may start to “go the other way” — for a trade.
(Click on image to enlarge)
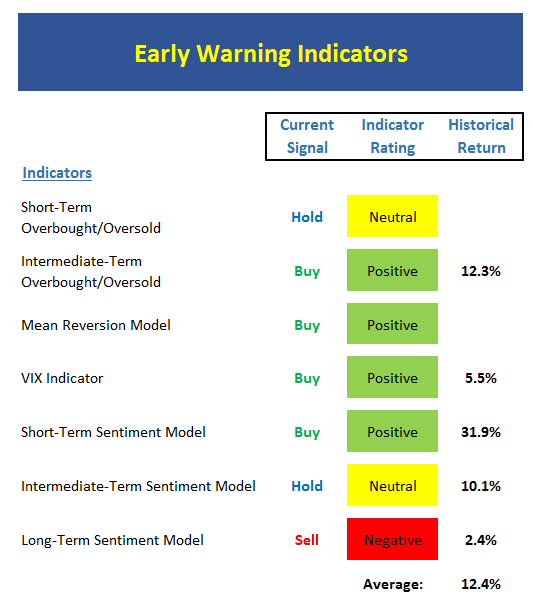
Executive Summary:
- From a near-term perspective, stocks have worked off the oversold condition
- From an intermediate-term view, stocks are oversold – but again, only modestly so. And from a long-term perspective, stocks are neutral.
- The Mean Reversion Model moved back to positive on Friday. However, we should note that this type of strategy has struggled of late due to the low volatility environment
- Both of our VIX Indicators flashed buy signals recently
- From a short-term perspective, market sentiment is remains a bit dour – which historically has been a plus for stocks
- The intermediate-term Sentiment Model remains at the low end of neutral, which has led to average returns for stocks
- Longer-term Sentiment readings continue to run contrary to the shorter-term models with the model still deep in negative territory
The State of the Macro Picture
Now let’s move on to the market’s “external factors” – the indicators designed to tell us the state of the big-picture market drivers including monetary conditions, the economy, inflation, and valuations.
(Click on image to enlarge)
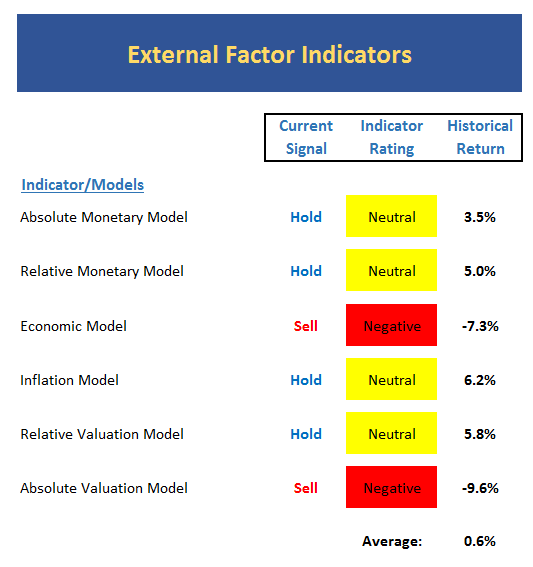
Executive Summary:
- Absolute Monetary conditions remain in the lower reaches of neutral and at the lowest levels since the “Taper Tantrum” in 2013
- On a relative basis, monetary conditions have actually improved, taking the model back up into the neutral zone
- No change to our Economic Model (designed to call the stock market), which continues to “get it wrong” – but with a strong historical record, we will give the model a pass here
- As expected, the Inflation Model slipped back into the neutral zone last week. This tells us that we may have seen a peak in inflation expectations. A message that the bond market appears to agree with at this point
- Our Relative Valuation Model remains neutral but heading the wrong direction
- The Absolute Valuation Model is still waving a big red flag as it is at one of the highest readings ever if one removes the bubble and crisis period
The State of the Big-Picture Market Models
Finally, let’s review our favorite big-picture market models, which are designed to tell us which team is in control of the prevailing major trend.
(Click on image to enlarge)
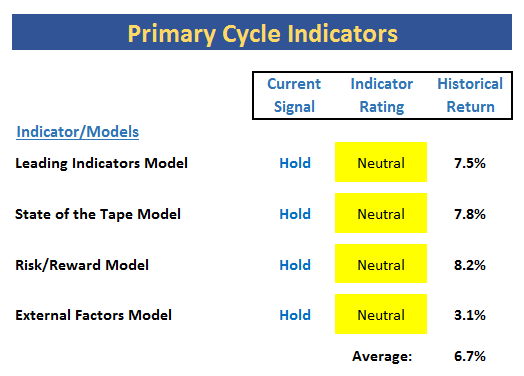
Executive Summary:
- The Leading Indicators model, which did a fine job during the last bear phase, has upticked to the neutral zone – BUT – remains on a sell signal
- The Tape remains neutral at this time
- The Risk/Reward model has improved to neutral, where stocks have done “ok” historically
- The External Factors model has turned higher and is now very close to dead neutral
The Takeaway…
Last week, I noted that while stocks appeared to be in a downtrend, the oversold condition provided some hope. And while last week’s rebound was less than robust (likely due to the first round of elections in France) the technical picture has improved. However, the caveat that cropped up time and time again in this week’s review of the model boards is that the improvement in the indicators is (a) modest and (b) easily reversed. And with a downtrend line still intact on the chart of the SPX, we will continue to watch the key lines in the sand at 2320 on the downside and 2400 on the upside.
Thought For The Day:
Sometimes you have to forget what’s gone, appreciate what remains, and look forward to what’s coming next.
Current Market Drivers
We strive to identify the driving forces behind the market action on a daily basis. The thinking is that if we can both identify and understand why stocks are doing what they are doing on a short-term basis; we are not likely to be surprised/blind-sided by a big move. Listed below are what we believe to be the driving forces of the current market (Listed in order of importance).
1. The State of Geopolitical Issues
2. The State of Earning Season
3. The State of Trump Administration Policies
4. The State of the U.S. Economy



Comments
Log in or sign up to join the conversation.