
Stocks Have An Endless Bid
The S&P 500 was up again on Monday, foiling my thesis that there would be a correction this week. The S&P 500 is up 5 out of 5 days this year for a gain of 2.77%. Some investors who outperformed last week already had gains which equal a good year in the first 4 days of trading. It doesn’t get much better than that. This is the best start to a year since 2006. The best streak of record highs to start a year was 6 in 1964. The 2.6% increase last week would have been the best week in 2017, showing that the momentum has only accelerated. As we’ve discussed, when stocks have a good January, it means the rest of the year is going to be great. In the 15 years where stocks were up 2% or more in the first 5 days, the full year return has been positive every time with a median return of 18.9%.
My bearishness on high yield debt hasn’t worked out yet either as the HYG is up 0.64% year to date. Anything which is risky is catching a big at a higher rate than last year. The chart below shows us what we already know; the sentiment is high. It is the highest since late 2016. Since 2013, the bull market has continued regardless of whether the near term optimism has reached extreme levels. As we’ve discussed, low volatility and high sentiment beget higher optimism and lower volatility. It’s a self-fulfilling situation until a catalyst derails it.
(Click on image to enlarge)

S&P 1500 Estimates Also Look Good
While the high sentiment implies stocks are in a euphoric bubble, that’s not what’s happening. The earnings are backing up the rally making this time different. It’s easy to wax poetically about how long term returns will be low, but as long as the earnings come through, the intermediate term performance will look good. We’ve discussed the solid results that are expected to be reported in the S&P 500, starting this week. The chart below supports that concept as the 4 year rolling total S&P 1500 earnings estimate revisions are in the strongest uptrend since at least 2008. Earnings growth won’t be the fastest of this cycle because the 2010 earnings results had easy comparisons, but the results will be the most impressive. It’s unprecedented to see such a sharp push higher at the end of a cycle. That’s what happens when tax cuts come 9 years into an expansion.
(Click on image to enlarge)

Telecom & Energy The Biggest Winners From Tax Cut
Speaking of the effect of the tax cut, the chart below gives a sector breakdown of how firms will be affected by the changes in deferred tax liabilities as a result of the new tax plan. The revaluation will help the telecom and energy sectors the most. This another reason in the list of the ones I’ve previously given, which includes that commodities do well at the end of the business cycle and that energy stocks have lagged the price of oil, that makes energy stocks a buy. The technology sector is helped the least by this revaluation. The bright side is many of these firms have large cash hordes that will be repatriated from overseas at the temporarily lowered rate.
(Click on image to enlarge)

Guidance Exploding To The Upside
The increase in global trade and the tax cut have made for a great combined catalyst for an improvement in corporate earnings. This is shown by the chart below which reviews the historical 3 month average of the difference between up guidance and down guidance plus 50% of neutral guidance divided by the total firms offering guidance. This company offered guidance index is unlike the pre-announcement indicator because it works in tandem with the actual results firms report. As you can see, it was negative in 2015 which was a bad year for earnings. The index was high in 2010 because firms had to go from cautious to optimistic. This guidance optimism is a great indicator for 2018 earnings. The fact that the guidance positivity rivals 2010 is remarkable given the already heightened estimates. For the first time this cycle, earnings estimates for the full year started out high and moved higher.
(Click on image to enlarge)

Do Earnings Matter?
The argument we’re about to discuss goes directly against the narrative I’ve explained in this article and the previous one. Since price performance comes from calculating the changes in earnings and the multiple, some investors believe earnings are more important and some think multiples are more important. Those who say earnings are more important, claim multiples usually increase when earnings are growing because optimism is up. Those who say multiples drive returns say that stocks are affected by sentiment, interest rates, and inflation more than earnings. Obviously, earnings are affected by those aspects as well, but we can adjust for earnings growth to see if multiples control stocks more than earnings.
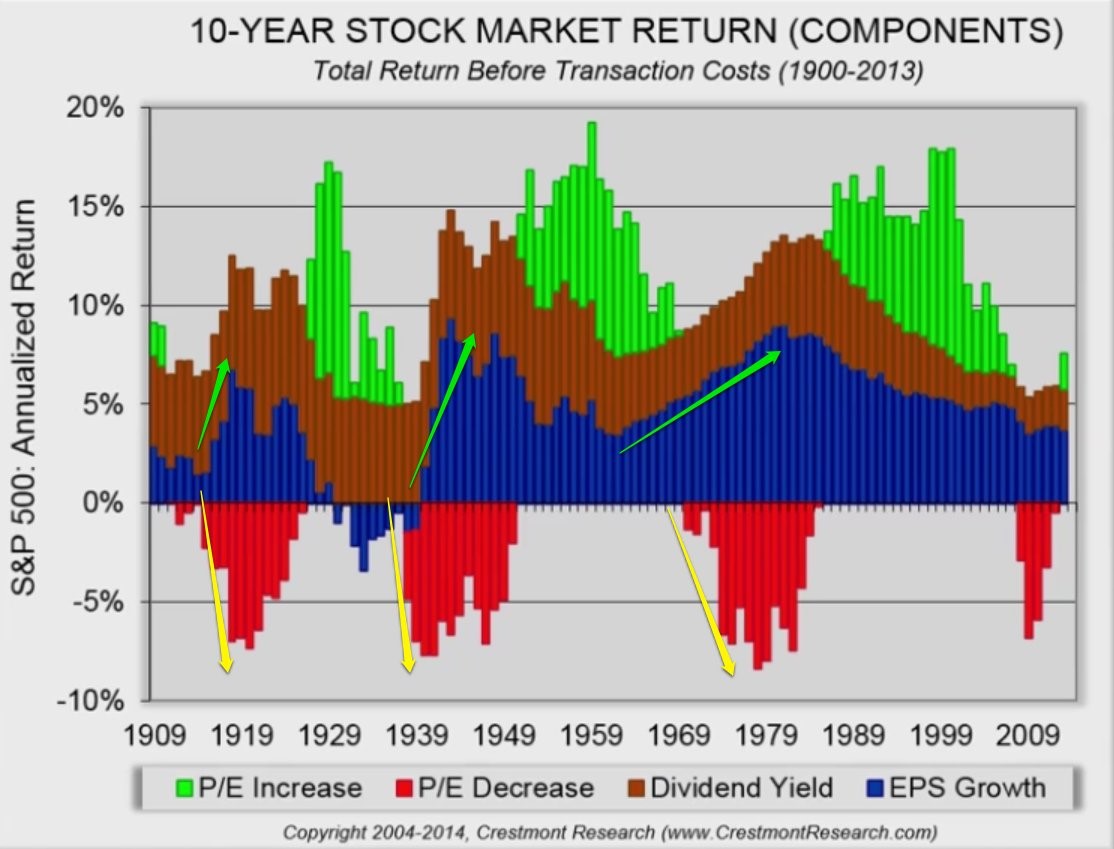
At the least, the chart below gives three distinct examples where earnings growth accelerated, but annualized 10 year returns were negative. If earnings growth was the only aspect that pushed stocks higher, the Shiller PE would be stagnant. The reality is there have been circumstances where earnings growth has moved up and stocks haven’t. This means, you need to do more research than just forecasting where earnings are going. As per usual, the simplistic narrative of just following earnings doesn’t give a complete answer as to where stocks are headed.
(Click on image to enlarge)
Conclusion
I’m not saying that you should ignore the great earnings that are about to be reported. If they beat results by a large enough margin, traders certainly won’t ignore the results as the stocks which beat will be pushed higher. Some debate that the central banks have created the endless bid in stocks which makes the idea of a selloff in the midst of earnings growth impossible. All these opinions are what make the market. The logic of focusing on multiples over earnings is an interesting opinion which doesn’t get much coverage in the financial press, which is why I included it. If you are arguing that multiples are what matter, it makes the concept of focusing so hard on earnings results look ridiculous. It exposes the market as driven by speculative runs rather than fundamentals. I think short term movements are driven by money flows and long term performance is driven by fundamentals, but I also agree that multiples are an important factor as well. This is why I study the CAPE religiously to determine long term returns.


Comments
Log in or sign up to join the conversation.