

Chart no longer available from the original source.
For us we’ve been standing aside of market action for the past two months expecting more of this interference.
Economic data overall continued to weaken. The standout performance to the downside was Existing Home Sales which plunged 10.5%. GDP data was adjusted lower but only slightly so weighed down by high inventory hangover. FHFA Home Prices were higher but lagged the previous month 0.5% from prior 0.7%.
As usual we post the GDP Report analysis fromConsumer Metrics Institute with the summary below. The entire report is posted here.
Summary and Commentary
The revisions offered in this report were minimal and certainly not statistically significant. The most material revision was provided by the volatile, flaky and ultimately zero-reverting inventory data. If we had to ignore the noise and provide some "take away" from this report, they are probably as follows:
-- In general, the economic growth provided by consumer spending is reported to be softening -- although the data on consumer spending for services has arguably become less reliable as a direct consequence of Obamacare.
-- The quarter-to-quarter increase in the household savings rate (to 5.2%) goes a long way towards explaining the ongoing weak retail sales. Household monies that are no longer being spent at the gasoline pump are simply being saved. This implies that households are not particularly confident when looking forward.
-- Once again the contribution of exports to the headline number is a mere one-sixth what it was in the second quarter. The soaring dollar and plunging global economy have likely caught up with US exporters. In coming quarters, we may look favorably back on a time when exports provided any growth at all.
-- The core domestic economy seems to be transitioning to (at least) slower growth, with exports leading the way.
-- The arguably high "deflators" utilized for this report may have skewed the headline number downward. For this reason alone, it is possible that the real economy may have been performing better than these numbers would lead us to believe.
There was probably nothing of consequence in this report: none of the reported revisions were statistically significant, and -- based on historical precedence -- all of this data will be materially revised next July.
That said, we look forward to data coming in the new year that will be much more interesting.
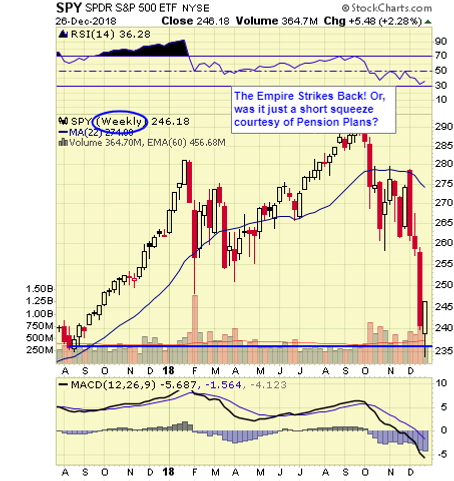
Stocks rallied once again led initially by energy sectors then later all sectors piled-in. This didn’t surprise me one bit which again is why we’re laying low understanding this manipulation was likely.
Market sectors moving higher included: Dow (DIA), S&P 500 (SPY), Tech (QQQ), Financials (XLF), Industrials (XLI), Utilities (XLU), Energy (XLE), Retail (XRT), Consumer Discretionary (XLY), Homebuilders (ITB), Consumer Staples (XLP), Materials (XLB), Small Caps (IWM), Europe (IEV), UK (EWU), Emerging Markets (EEM), EAFE (EFA), Brazil (EWZ), Crude Oil (USO), Russia (RSX), Junk Bonds (HYG) and many more.
Market sectors moving lower included: Treasury Bonds (TLT), Volatility (VIX), Gold (GLD), Natural Gas (UNG) and few others.
The top ETF daily market movers by percentage change in volume whether rising or falling is available daily.
Volume improves even as liquidity is supposed to diminish. Give that another day methinks. Breadth per the WSJ was positive.
Chart no longer available from the original source.
As I indicated Monday there’s more economic data due on Wednesday including: Durable Goods Orders; Personal Income & Spending; New Home Sales and Consumer Sentiment.
That should then end my posting for the week and enjoy family and friends. But, that said, you never know when the forces of darkness will cause a reappearance.
Let’s see what happens.


Comments
Log in or sign up to join the conversation.