
Sears Holdings Corporation (SHLD), the parent of Kmart and Sears, Roebuck and Co., is the leading home appliance retailer in North America and is a retail sales leader in tools, lawn and garden, home electronics, and automotive repair and maintenance. Key proprietary brands include Kenmore, Craftsman and DieHard, and a broad apparel offering, including such well-known labels as Lands' End, Jaclyn Smith and Joe Boxer, as well as the Apostrophe and Covington brands.
Today, Sears reported Q3 earnings results for 2015 and they were not good. Sears reported a loss of $454 million, or $4.26 a share, compared with a loss of $548 million, or $5.15, a year earlier. Adjusted for significant items, Sears would have reported a net loss attributable to Holdings' shareholders of $305 million ($2.86 loss per diluted share) for the quarter compared to a net loss attributable to Holdings' shareholders of $288 million ($2.71 loss per diluted share) in the prior year quarter.
Kmart and Sears Domestic comparable store sales declined 7.5% and 9.6%, respectively, in the third quarter of 2015 with more than half of the decline coming from declines in apparel and consumer electronics. Revenues decreased approximately $1.5 billion to $5.8 billion for the quarter ended October 31, 2015, compared to revenues of $7.2 billion for the quarter ended November 1, 2014.
Edward S. Lampert, Holdings' Chairman and Chief Executive Officer, said
We remain focused on restoring Sears Holdings to profitability by concentrating on our best stores, rewarding our best members and pursuing our best categories through innovative solutions to product and service offerings. Through deliberate strategic actions, notably with respect to our promotional design and marketing spend, we have made meaningful progress in our transformation and reported a fifth consecutive quarter of improved year-over-year results.As expected, the results of these actions have led to comparable store sales declines despite an increase in profitability.At the same time, we recognize a lot of work remains and we have brought in a number of experienced leaders to drive our business forward with a plan to win as a member-centric integrated retailer. As we head into the fourth quarter, we have intensified our focus on our product offerings and promotions in order to enhance member engagement and provide our members with the best experience possible throughout the holiday shopping season.
We have been down on this stock for a very long time. For the most part, we have had it ranked a SELL or STRONG SELL since January, 2014. It's tough to get a sense of what this means for retail in general given the fact that Sears has been in trouble for a very long time now. They have been unable to make the transition necessary to compete with the Amazons and Targets and Wal-Marts of the world and it is tough to figure out why customers would seek them out.
They have yet to recover from the self-inflicted disaster caused by the reign of CEO and hedge-fund guru Lampert. Since Lampert took over in 2005, the trend is clear, and it is not pretty. So, we find little here to use as an evaluation of the broader retail sector, the US economy in general, consumer confidence and spending, the overall holiday shopping potential, etc.
If anything, we think is yet another case of a so-called financial "genius" getting in over his head and attempting to apply ideological solutions some place they don't belong--and wrecking a storied company in the process. Like JCPenney, this company is struggling, and we don't see the end game or the recovery coming anytime soon.
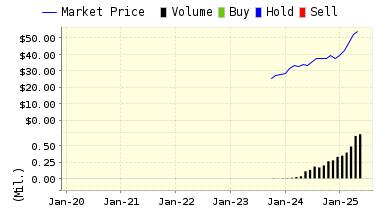
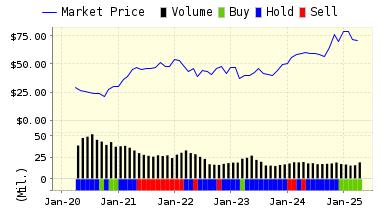
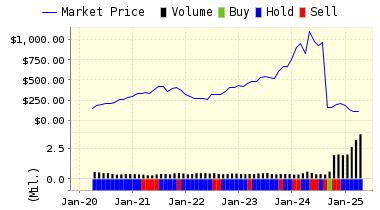
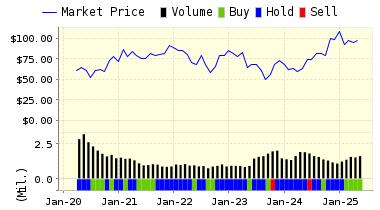
ValuEngine continues its STRONG SELL recommendation on SEARS HOLDINGS for 2015-12-02. Based on the information we have gathered and our resulting research, we feel that SEARS HOLDINGS has the probability to UNDERPERFORM average market performance for the next year. The company exhibits UNATTRACTIVE P/E Ratio and Earnings Growth Rate.
|
ValuEngine Forecast |
||
|
Target |
Expected |
|
|---|---|---|
|
1-Month |
20.19 | -1.08% |
|
3-Month |
19.87 | -2.65% |
|
6-Month |
19.67 | -3.61% |
|
1-Year |
17.77 | -12.94% |
|
2-Year |
20.78 | 1.83% |
|
3-Year |
22.65 | 10.99% |
ValuEngine Market Overview
|
Summary of VE Stock Universe |
|
|
Stocks Undervalued |
52.04% |
|
Stocks Overvalued |
47.96% |
|
Stocks Undervalued by 20% |
23.75% |
|
Stocks Overvalued by 20% |
17.18% |
ValuEngine Sector Overview
|
Sector |
Change |
MTD |
YTD |
Valuation |
Last 12-MReturn |
P/E Ratio |
|
-0.32% |
0.60% |
1.01% |
6.16% overvalued |
-2.54% |
25.01 |
|
|
-0.63% |
-0.00% |
6.84% |
6.06% overvalued |
0.40% |
23.97 |
|
|
-0.57% |
-0.09% |
3.57% |
4.60% overvalued |
1.29% |
29.10 |
|
|
-1.15% |
-0.10% |
5.21% |
4.51% overvalued |
4.93% |
28.31 |
|
|
-0.65% |
-0.51% |
-8.89% |
4.24% overvalued |
-9.30% |
17.52 |
|
|
-0.66% |
-0.44% |
2.54% |
2.37% overvalued |
-1.62% |
20.37 |
|
|
-0.85% |
-0.37% |
2.70% |
2.02% overvalued |
-2.15% |
16.52 |
|
|
-1.26% |
-0.54% |
2.93% |
1.06% overvalued |
-1.92% |
21.31 |
|
|
-1.12% |
-0.60% |
-6.06% |
1.51% undervalued |
-7.90% |
19.00 |
|
|
-0.53% |
0.07% |
0.99% |
1.52% undervalued |
-3.14% |
25.44 |
|
|
-1.12% |
-0.62% |
-6.24% |
3.12% undervalued |
-8.74% |
22.18 |
|
|
-0.53% |
-0.25% |
-7.16% |
5.70% undervalued |
-7.07% |
23.02 |
|
|
-0.97% |
-1.34% |
-5.22% |
7.77% undervalued |
-7.11% |
13.61 |
|
|
-2.64% |
-2.41% |
-24.07% |
9.46% undervalued |
-37.16% |
23.78 |
|
|
-1.70% |
-1.16% |
-13.81% |
11.04% undervalued |
-19.98% |
13.94 |
|
|
-1.16% |
-0.15% |
-17.79% |
14.00% undervalued |
-22.95% |
23.86 |
VALUATION WATCH: Overvalued stocks now make up 49.96% of our stocks assigned a valuation and 17.18% of those equities are calculated to be overvalued by 20% or more. Eight sectors are calculated to be overvalued.
Comments
Log in or sign up to join the conversation.