
It took some extra cash and effort, but the long-proposed merger deal between SAB Miller and AB InBev is now a reality with the news today that SAB Miller accepted a sweetened offer from Anheuser-Busch InBev SA/NV totaling at $104 billion.
The resultant firm would dominate every beer market across the globe and big macro brewers are already facing scrutiny for anti-competitive practices related to their purchase of distributors. That sort of vertical integration sets off alarm bells for smaller competitors and craft brews.
And, is bigger always better? While the merged companies would own almost 30% of the global market, macro players still have no answer for the craft juggernaut, and acquiring a ton of other large macro brews hardly seems like an effective strategy for satisfying the tastes of the world's increasingly demanding--and fickle--craft drinkers.
But that problem exists in developed markets--where overall beer consumption is flat/shrinking. In emerging markets such as Africa--where SAB Miller is a the big player, there may still be room for growth in the macro portion of the market. And, SAB Miller also brings a strong soft-drink business the table. That should help Anheuser-Busch InBev SA/NV as sales of Budweiser and Bud Light continue to plummet.
Of course the real question now is whether or not regulators will allow this behemoth to occur. And SAB Miller certainly is aware that the deal may get shot down, they asked for--and received--a $3 billion payment if regulators refuse to green light the massive merger.
Details still need to be worked out here. The companies will have to divest themselves of certain brands to avoid even more antitrust scrutiny, undoubtedly jobs will be cut on both sides, and some beers will be phased out in an effort to force macro consumers into flagship products such as Budweiser.
Below, we present the latest data on the two beverage giants. First some key metrics compared, then the more extensive data from our systems. Neither of the stocks is currently rated a BUY.
|
Ticker |
Company Name |
Market Price |
Valuation |
Last 12-M Retrn |
1-M Forecast Retn |
1-Yr Forecast Retn |
Market Cap (bil) |
P/E Ratio |
|
Anheuser-Busch InBev SA/NV |
111.49 |
-2.27% |
5.15% |
0.05% |
0.58% |
179.12 |
20.57 |
|
|
SABMILLER PLC |
56.7 |
N/A |
8.87% |
-0.04% |
-0.51% |
91.46 |
24.18 |
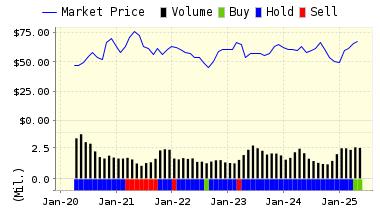
Below is today's data on Anheuser-Busch InBev SA/NV:
Anheuser-Busch InBev SA/NV (BUD) is the leading global brewer and one of the world's top five consumer products companies. Their portfolio of well over 200 beer brands continues to forge strong connections with consumers. They invest the majority of their brand-building resources on their Focus Brands - those with the greatest growth potential such as global brands Budweiser, Stella Artois and Beck's, alongside Leffe, Hoegaarden?, Bud Light, Skol, Brahma, Antarctica, Quilmes, Michelob Ultra, Harbin, Sedrin, Klinskoye, Sibirskaya Korona, Chernigivske, Hasserder and Jupiler. In addition, the company owns a 50 percent equity interest in the operating subsidiary of Grupo Modelo, Mexico's leading brewer and owner of the global Corona brand
Recommendation: Wecontinue with HOLD recommendation on Anheuser-Busch InBev SA/NV for 2015-10-12. Based on the information we have gathered and our resulting research, we feel that Anheuser-Busch InBev SA/NV has the probability to ROUGHLY MATCH average market performance for the next year. The company exhibits ATTRACTIVE Company Size but UNATTRACTIVE Price Sales Ratio.
|
ValuEngine Forecast |
||
|
Target |
Expected |
|
|---|---|---|
|
1-Month |
111.54 | 0.05% |
|
3-Month |
111.83 | 0.31% |
|
6-Month |
112.45 | 0.86% |
|
1-Year |
112.14 | 0.58% |
|
2-Year |
116.54 | 4.53% |
|
3-Year |
108.84 | -2.38% |
|
Valuation & Rankings |
|||
|
Valuation |
2.27% undervalued |
Valuation Rank |
|
|
1-M Forecast Return |
0.05% |
1-M Forecast Return Rank |
|
|
12-M Return |
5.15% |
Momentum Rank |
|
|
Sharpe Ratio |
0.62 |
Sharpe Ratio Rank |
|
|
5-Y Avg Annual Return |
11.86% |
5-Y Avg Annual Rtn Rank |
|
|
Volatility |
19.01% |
Volatility Rank |
|
|
Expected EPS Growth |
1.20% |
EPS Growth Rank |
|
|
Market Cap (billions) |
179.12 |
Size Rank |
|
|
Trailing P/E Ratio |
20.57 |
Trailing P/E Rank |
|
|
Forward P/E Ratio |
20.33 |
Forward P/E Ratio Rank |
|
|
PEG Ratio |
17.15 |
PEG Ratio Rank |
|
|
Price/Sales |
3.91 |
Price/Sales Rank |
|
|
Market/Book |
3.48 |
Market/Book Rank |
|
|
Beta |
0.98 |
Beta Rank |
|
|
Alpha |
-0.02 |
Alpha Rank |
Valuation Watch: Overvalued stocks now make up 44.61% of our stocks assigned a valuation and 14.49% of those equities are calculated to be overvalued by 20% or more. Four sectors are calculated to be overvalued.
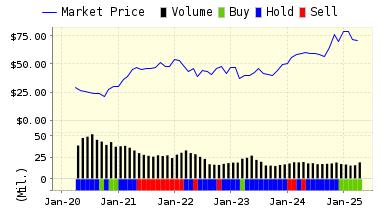
Also, here is today's data on SABMiller plc:
SABMiller plc (SBMRY) is one of the world's largest brewers with brewing interests or distribution agreements in over sixty countries across six continents. The principal activities of the Company and its subsidiaries are the manufacture, distribution and sale of beverages. The group's brands include premium international beers such as Grolsch, Miller Genuine Draft, Peroni Nastro Azzurro and Pilsner Urquell, as well as an exceptional range of market leading local brands. Outside the USA, SABMiller plc is also one of the largest bottlers of Coca-Cola products in the world.
Recommendation: We continue with HOLD recommendation on SABMiller plc for 2015-10-12. Based on the information we have gathered and our resulting research, we feel that SABMiller plc has the probability to ROUGHLY MATCH average market performance for the next year. The company exhibits ATTRACTIVE Company Size but UNATTRACTIVE Book Market Ratio.

|
ValuEngine Forecast |
||
|
Target |
Expected |
|
|---|---|---|
|
1-Month |
111.54 | 0.05% |
|
3-Month |
111.83 | 0.31% |
|
6-Month |
112.45 | 0.86% |
|
1-Year |
112.14 | 0.58% |
|
2-Year |
116.54 | 4.53% |
|
3-Year |
108.84 | -2.38% |
|
Valuation & Rankings |
|||
|
Valuation |
2.27% undervalued |
Valuation Rank |
|
|
1-M Forecast Return |
0.05% |
1-M Forecast Return Rank |
|
|
12-M Return |
5.15% |
Momentum Rank |
|
|
Sharpe Ratio |
0.62 |
Sharpe Ratio Rank |
|
|
5-Y Avg Annual Return |
11.86% |
5-Y Avg Annual Rtn Rank |
|
|
Volatility |
19.01% |
Volatility Rank |
|
|
Expected EPS Growth |
1.20% |
EPS Growth Rank |
|
|
Market Cap (billions) |
179.12 |
Size Rank |
|
|
Trailing P/E Ratio |
20.57 |
Trailing P/E Rank |
|
|
Forward P/E Ratio |
20.33 |
Forward P/E Ratio Rank |
|
|
PEG Ratio |
17.15 |
PEG Ratio Rank |
|
|
Price/Sales |
3.91 |
Price/Sales Rank |
|
|
Market/Book |
3.48 |
Market/Book Rank |
|
|
Beta |
0.98 |
Beta Rank |
|
|
Alpha |
-0.02 |
Alpha Rank |
Market Overview
|
Summary of VE Stock Universe |
|
|
Stocks Undervalued |
55.39% |
|
Stocks Overvalued |
44.61% |
|
Stocks Undervalued by 20% |
23.13% |
|
Stocks Overvalued by 20% |
14.49% |
Sector Overview
|
Sector |
Change |
MTD |
YTD |
Valuation |
Last 12-MReturn |
P/E Ratio |
|
-1.92% |
4.44% |
-0.04% |
4.67% overvalued |
4.16% |
23.57 |
|
|
-1.72% |
4.30% |
-1.87% |
3.93% overvalued |
4.78% |
24.88 |
|
|
-1.16% |
2.67% |
-0.30% |
1.05% overvalued |
1.65% |
16.65 |
|
|
-3.63% |
4.36% |
-10.07% |
0.49% overvalued |
-5.41% |
20.37 |
|
|
-0.69% |
5.56% |
-5.42% |
0.54% undervalued |
-2.79% |
22.13 |
|
|
-1.65% |
4.07% |
-2.79% |
1.17% undervalued |
5.02% |
29.07 |
|
|
-0.69% |
4.82% |
2.74% |
1.24% undervalued |
4.91% |
26.57 |
|
|
-1.01% |
2.43% |
3.04% |
1.64% undervalued |
8.42% |
29.80 |
|
|
-1.33% |
4.30% |
-2.10% |
2.59% undervalued |
-3.24% |
17.83 |
|
|
-2.76% |
2.29% |
-7.89% |
2.91% undervalued |
5.23% |
22.70 |
|
|
-3.02% |
5.91% |
-9.02% |
3.24% undervalued |
-7.63% |
18.28 |
|
|
-2.65% |
4.10% |
-1.76% |
5.91% undervalued |
8.69% |
21.08 |
|
|
-1.70% |
6.29% |
-11.76% |
6.70% undervalued |
-1.58% |
15.98 |
|
|
-0.74% |
9.15% |
-3.22% |
8.28% undervalued |
5.15% |
13.61 |
|
|
-4.24% |
13.84% |
-17.32% |
8.90% undervalued |
-37.15% |
25.86 |
|
|
-5.26% |
7.83% |
-16.96% |
11.20% undervalued |
-19.93% |
24.15 |
Comments
Log in or sign up to join the conversation.