
The Russell 2000 (IWM) continues to outperform the S&P and the Nasdaq 100. This is somewhat of a catchup trade based off the outperformance of the other two indices for the last two years. Mega cap tech saw its valuations balloon, making small cap and regional banks look attractive that make up the Russell 2000.
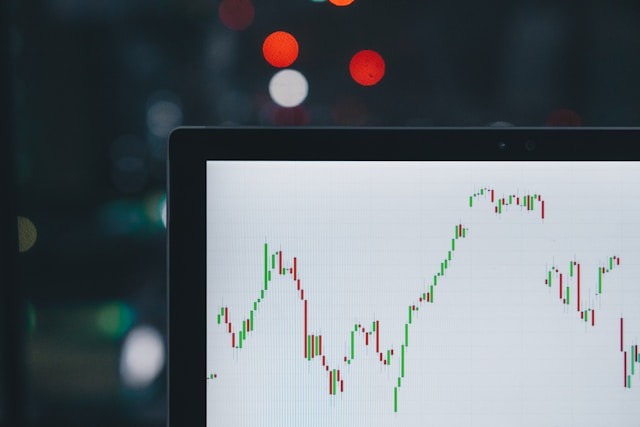
The technical Russell 2000 chart analysis signals continued upside that will likely run into major resistance at $167.05 on the IWM. This is major technical resistance because it is the gap fill from February 24th, 2020 when Covid-19 slammed the markets. Psychotically, this is an epic point for technical traders to short. There is likely, at a minimum, a 10% drop from this level once tagged. The Russell 2000 chart analysis is clear, look to short the $167.05 level.
(Click on image to enlarge)


Comments
Log in or sign up to join the conversation.