

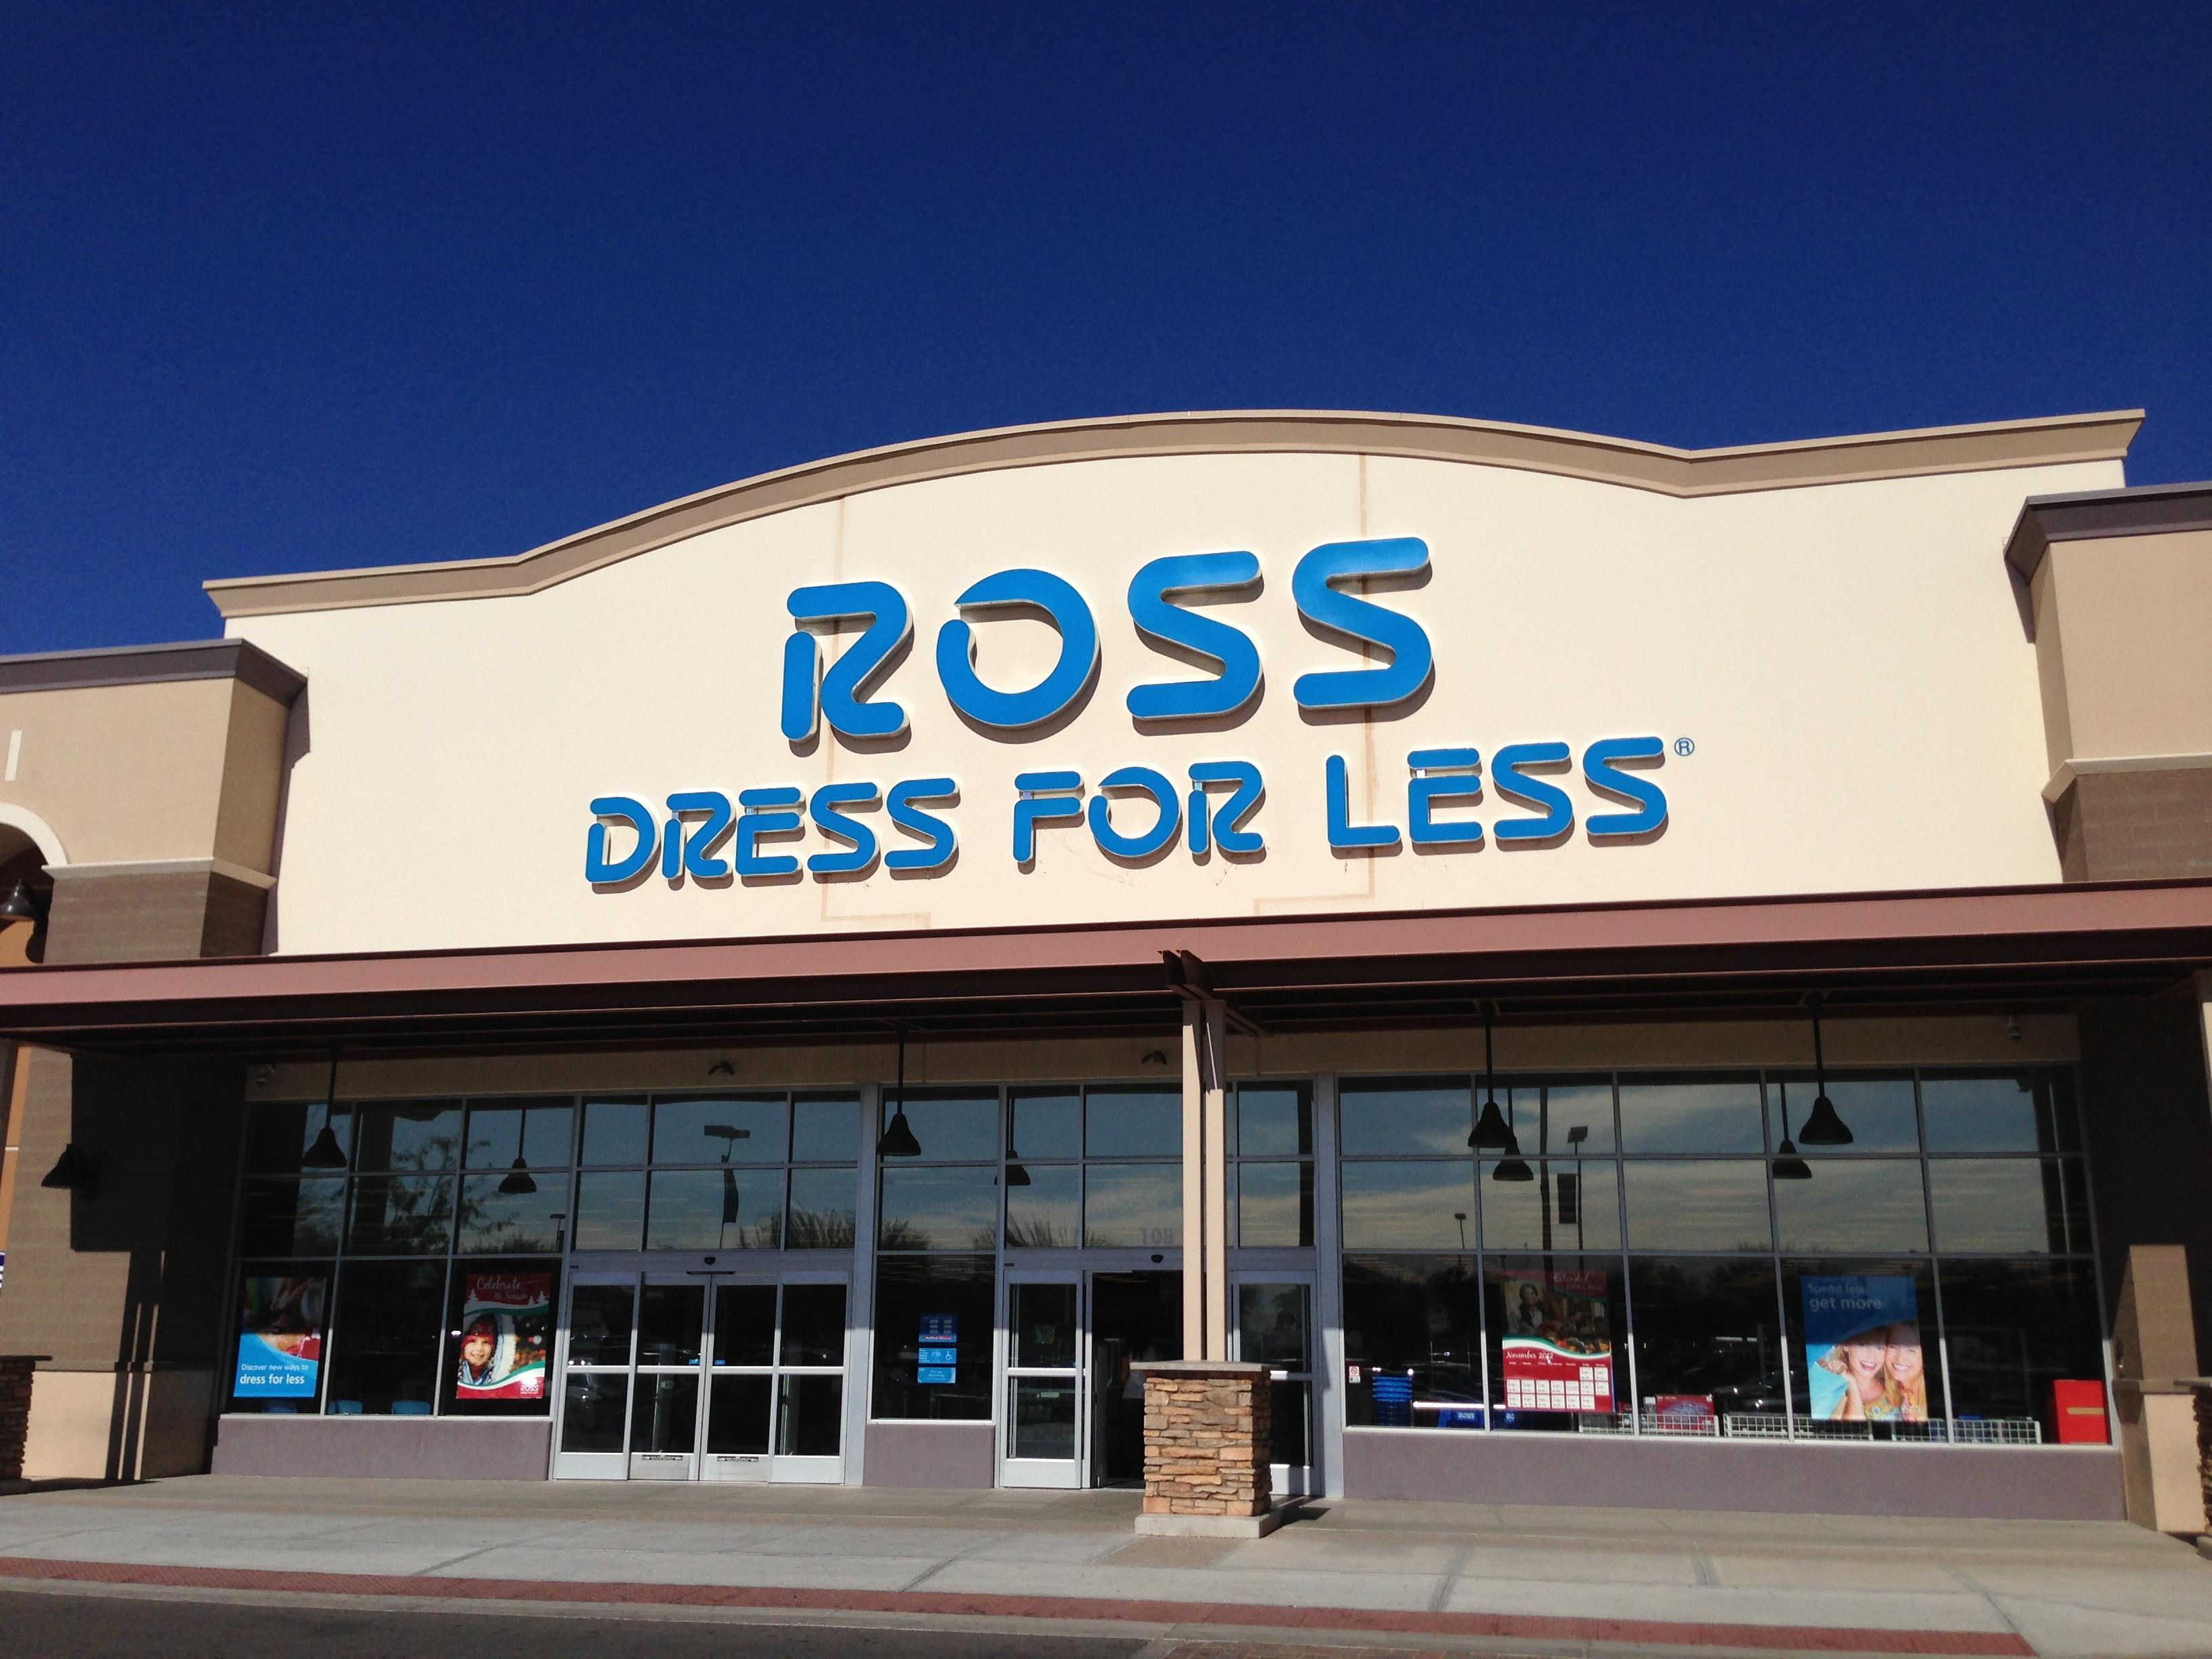
Ross Stores (ROST) has cratered by 17.5% year to date, despite decent first quarter results. I think it's one of the better retail stores out there, and faces less threats from Amazon (AMZN) than many of its retail peers. "There's always a bargain in store" is plastered on the first page of the company's annual report, and I think that this might also be a fitting description of its shares as well.
What makes Ross better than most?
Ross earns very impressive headline returns on invested capital, likely far in excess of its weighted average cost of capital, or WACC. I created the below chart (and all others in the rest of the article) in Excel using data from its 10-K.
(Click on image to enlarge)
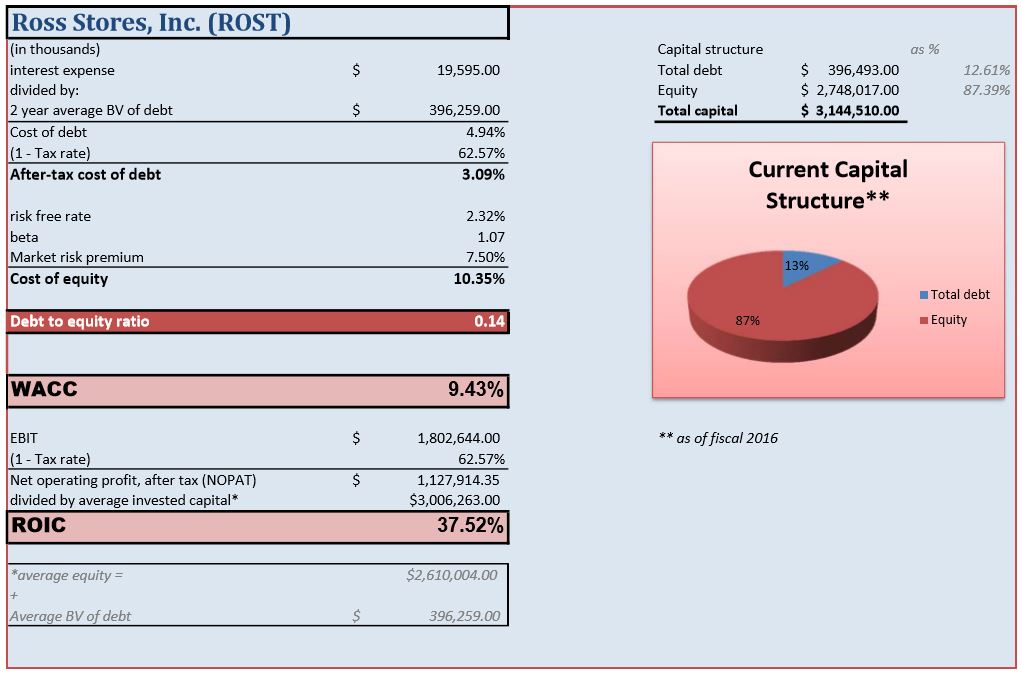
Ross has earned ROIC over 20% sustainably going back at least a decade, touching a little over 48% at its peak in 2013. It appears the company's capital structure is very "debt light" as well, but Ross also utilizes quite a bit of leases that I'd like to theoretically capitalize and insert back onto the balance sheet. To accomplish this, we first need to discount these leases to obtain an estimate of their present value. I used the company's pretax cost of debt as the discount rate.
(Click on image to enlarge)
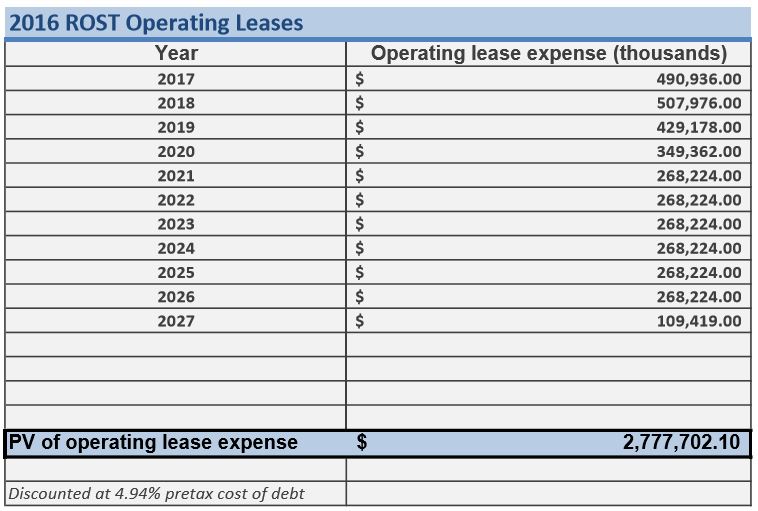
Now that we have this estimate, we can inject these liabilities back into the capital structure to get an adjusted debt-to-equity ratio.
(Click on image to enlarge)
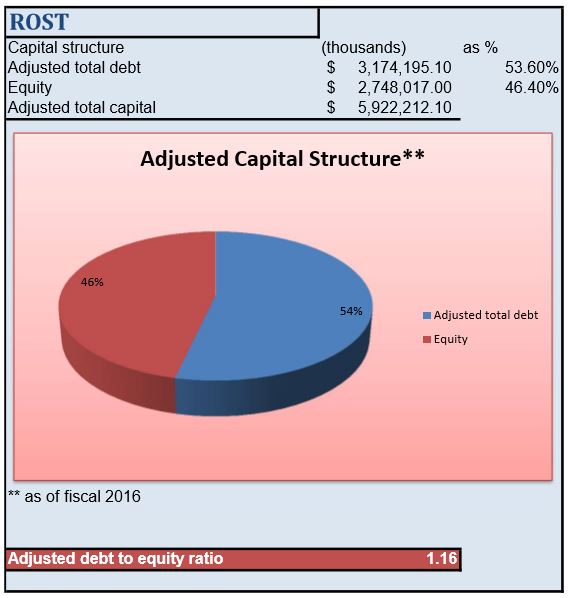
We can see that by capitalizing the leases, the firm's debt-to-equity ratio jumps to over 1x. This has implications for its ROIC as well.
Adjusting ROIC for off-balance sheet leases...
To gain insight into what effect the newly capitalized leases will have on Ross' return on invested capital, we need to start by adjusting its net operating profit after tax, or NOPAT (the numerator in the ROIC equation). The first step involves adjusting the firm's operating profit, or EBIT, first.
(Click on image to enlarge)
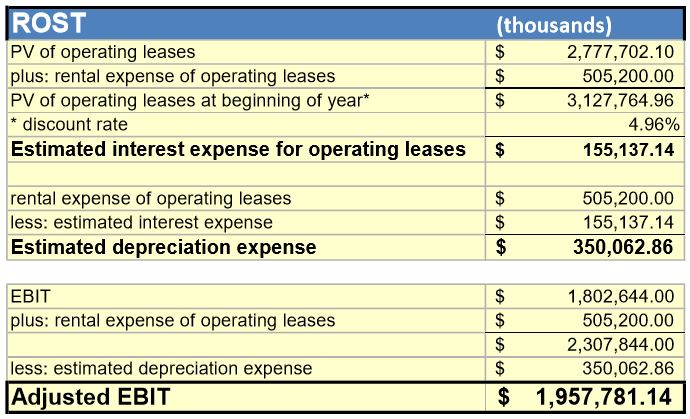
Now we can take taxes into account to calculate NOPAT, and divide it by the adjusted capital base denominator calculated earlier.
(Click on image to enlarge)
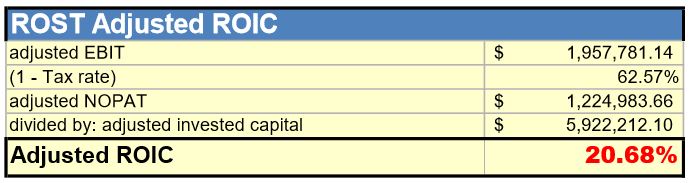
Ross' ROIC takes a notable dive from the headline 37% number when we account for its non-cancelable off-balance sheet leases. It's still pushing towards the better end of 21%, however, which is very impressive. I'd say that the firm still earns economic profits (aka ROIC exceeding WACC) after accounting for leases, which indicates a wide moat, at least quantitatively. Qualitatively, the firm's stores tend to attract customers searching for bargains amongst its disheveled shelves, which is an experience -- just as much as it is a trip just to go out buy something. Searching through racks of clothes looking for something cheap can't really be digitally duplicated, in my opinion.
What about the equity?
I'd also like to analyze return on equity. I created the below DuPont to break Ross' ROE down into five pieces to see what's been driving it recently.
(Click on image to enlarge)
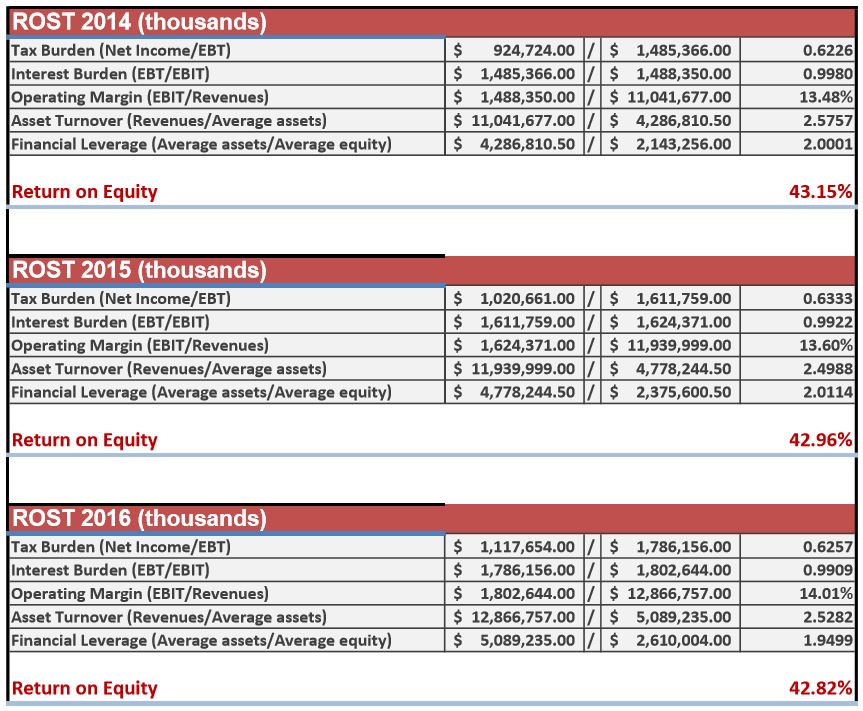
Ross has earned impressive returns on equity over the last three years, driven mostly by margin expansion and relatively stable asset turnover ratios. leverage has also been mostly stable and modest, dipping slightly in fiscal 2016. It appears the company is "running stuck in place" for the most part, but when sales are growing and you're spitting out north of 40% ROE each year, I think it's hard to find many critics. If tax reform ever comes along, it should also give a significant boost to ROE, as the primarily domestic company pays a relatively high effective tax rate, as can be seen by looking at its tax burden.
Conclusion
Ross Stores is an above-average operation in my opinion. It earns wide economic profits and creates an experience similar to treasure hunting for its customers that I suspect is hard to duplicate digitally. Ross is one of my favorite stocks after sifting through the retail wreckage left in Amazon's wake. It also appears to be relatively "recession-resistant" -- at least judging by the fact that annual earnings-per-share and revenues continued to increase even during the Great Recession. ROST shares now trade at about 17 times this year's expected earnings and a touch under 16 times forward earnings. The current dividend yield is also on the higher end of the historical range looking back over the past 5-10 years as well.

Comments
Log in or sign up to join the conversation.