

That’s the title of an NYT article today.
If rents continue to take off, it could be bad news both for those seeking housing and for the nation’s inflation outlook. Rental costs play an outsize role in the Consumer Price Index, so a meaningful rise in them could help keep that closely watched government price gauge, which has picked up sharply, higher for longer.
The CPI for shelter has risen more slowly than the CPI less shelter, so the thesis of the article must be that — as transitory upward pressure on goods and services ex-shelter dissipates, CPI-shelter has risen more than previously anticipated. And is expected to be more persistent than previously anticipated — reasonable given what seems to be strong wages and high demand.
First, what have each of the indices done since 2020M02.
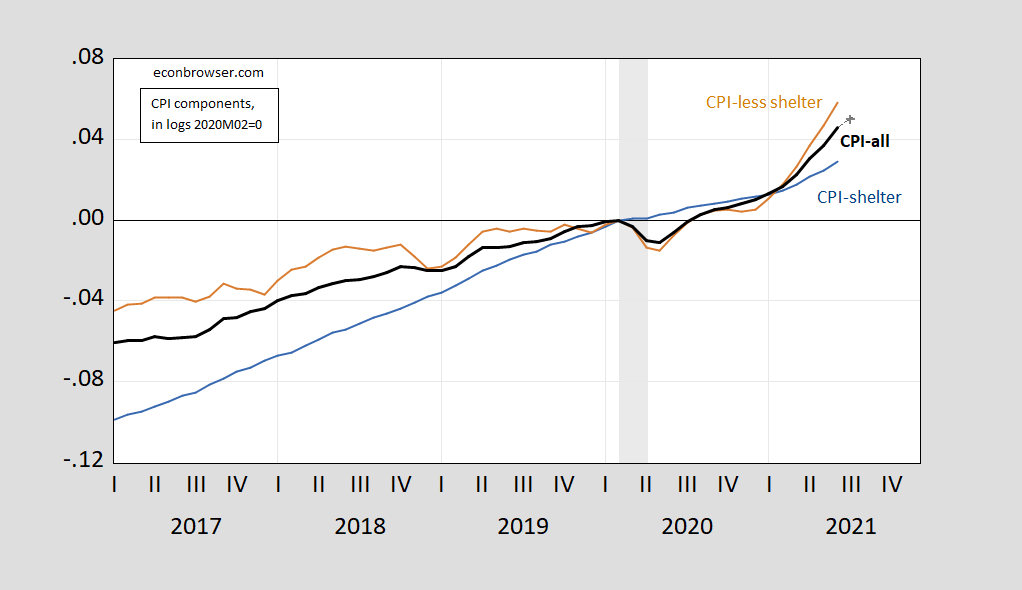
Figure 1: CPI-shelter (blue), CPI-less shelter (brown), CPI-all urban (bold black), CPI-all nowcast for July (gray +), all in logs, 2020M02=0. NBER defined recession dates shaded gray. Source: BLS via FRED, Cleveland Fed, NBER, and author’s calculations.
Since the NBER peak in 2020M02, CPI less shelter has risen 5.8%, vs. 2.9% for the CPI shelter component. Month-on-month CPI-less shelter inflation has consistently outpaced CPI shelter component in recent months. The Cleveland Fed nowcast of CPI has substantial deceleration marked for July.
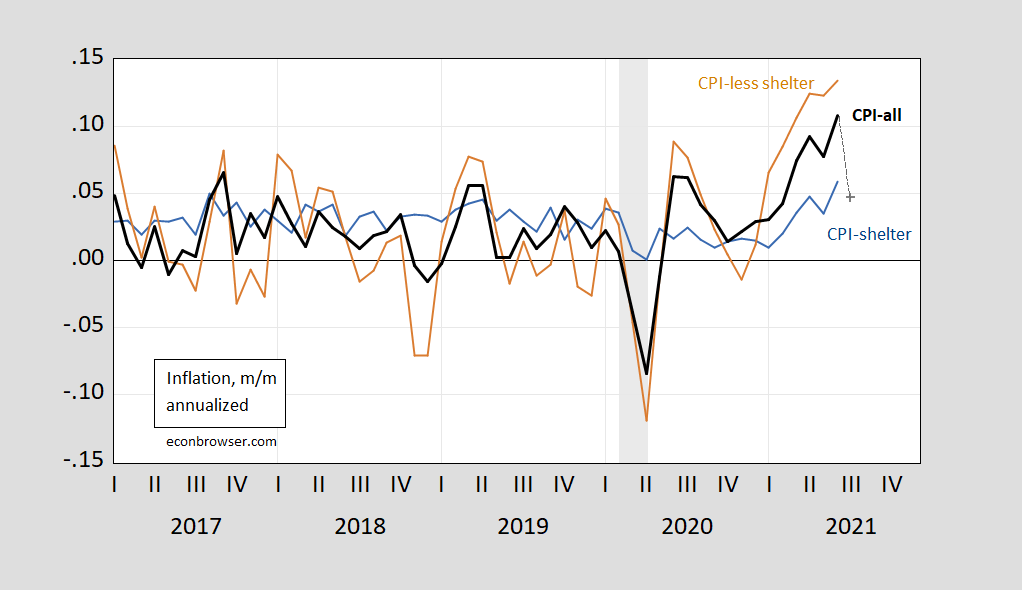
Figure 2: Month-on-month annualized inflation for CPI-shelter (blue), CPI-less shelter (brown), CPI-all urban (bold black), CPI-all Cleveland Fed nowcast (gray +), all calculated using log differences. NBER defined recession dates shaded gray. Source: BLS via FRED, Cleveland Fed, NBER, and author’s calculations.
from 1986-2019, the persistence of m/m CPI-shelter inflation was less than that of CPI-less shelter (as measured by the AR(1) coefficient), so the assumption of a transitory jump in shelter costs made sense. However, the special conditions surrounding the pandemic means that one wouldn’t want to rely on this historical pattern to hold.
The NYT article cites statistics from Zillow (in particular, the smoothed, not seasonally adjusted, series*). I’m not sure how useful the Zillow series will be for predicting the CPI rent component. Figure 3 plots the m/m growth rates of the Zillow series (seasonally adjusted) and the CPI rent of primary residence component.
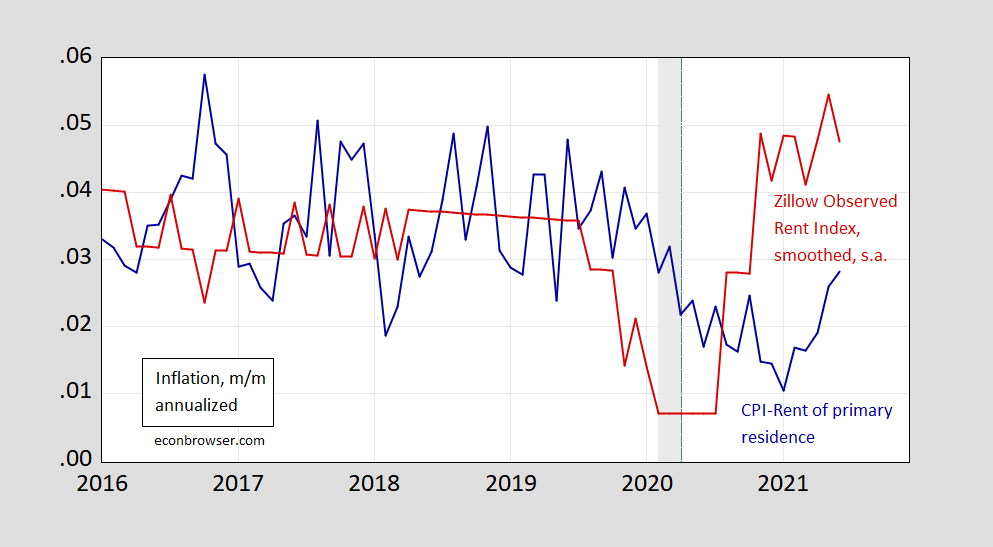
Figure 3: Month-on-month annualized inflation of CPI-rent of primary residence (blue), and of Zillow Observed Rent Index (ZORI), smoothed and seasonally adjusted (red), calculated as log differences. NBER defined recession dates shaded gray. Green dashed line at break in ZORI methodology. Source: BLS via FRED, Zillow, and author’s calculations.
At the month-on-month frequency, there’s no relationship between the two series; there one at the 12-month frequency. Generally, it seems like it’s an open question whether housing will keep inflation more persistently high than originally anticipated.
* Note that for some odd reason, the 12-month change in the seasonally unadjusted smoothed Zillow series does not look like the 12-month change in the seasonally adjusted smoothed Zillow series.



Comments
Log in or sign up to join the conversation.