

(Click on image to enlarge)

Of the four regional Federal Reserve surveys released to date, all are in expansion.
Analyst Opinion of Richmond Manufacturing
The important Richmond Fed subcategories significantly accelerated. This was a stronger report than last month.
Market expectations from Nasdaq / Econoday was 14 to 16 (consensus 16). The actual survey value was 20 [note that values above zero represent expansion].
Summary of all Federal Reserve Districts Manufacturing:
Richmond Fed (hyperlink to reports):
(Click on image to enlarge)

z richmond_man.PNG
Kansas Fed (hyperlink to reports):
(Click on image to enlarge)

z kansas_man.PNG
Dallas Fed (hyperlink to reports):
(Click on image to enlarge)

z dallas_man.PNG
Philly Fed (hyperlink to reports):
(Click on image to enlarge)

z philly fed1.PNG
New York Fed (hyperlink to reports):
(Click on image to enlarge)

z empire1.PNG
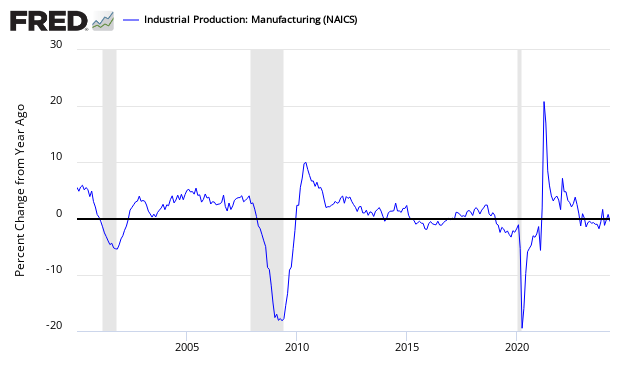
Federal Reserve Industrial Production - Actual Data (hyperlink to report):
(Click on image to enlarge)
Holding this and other survey's Econintersect follows accountable for their predictions, the following graph compares the hard data from Industrial Products manufacturing subindex (dark blue bar) and US Census manufacturing shipments (lighter blue bar) to the Richmond Fed survey (darkest bar).
(Click on image to enlarge)

In the above graphic, hard data is the long bars, and surveys are the short bars. The arrows on the left side are the key to growth or contraction.


Comments
Log in or sign up to join the conversation.