

Today the Richmond Fed Manufacturing Composite Index increased to 5 for the month of May, up from last month's 3. Investing.com had forecast 6. Because of the highly volatile nature of this index, we include a 3-month moving average to facilitate the identification of trends, now at 6.0, which indicates expansion. The complete data series behind today's Richmond Fed manufacturing report, which dates from November 1993, is available here.
Here is a snapshot of the complete Richmond Fed Manufacturing Composite series.
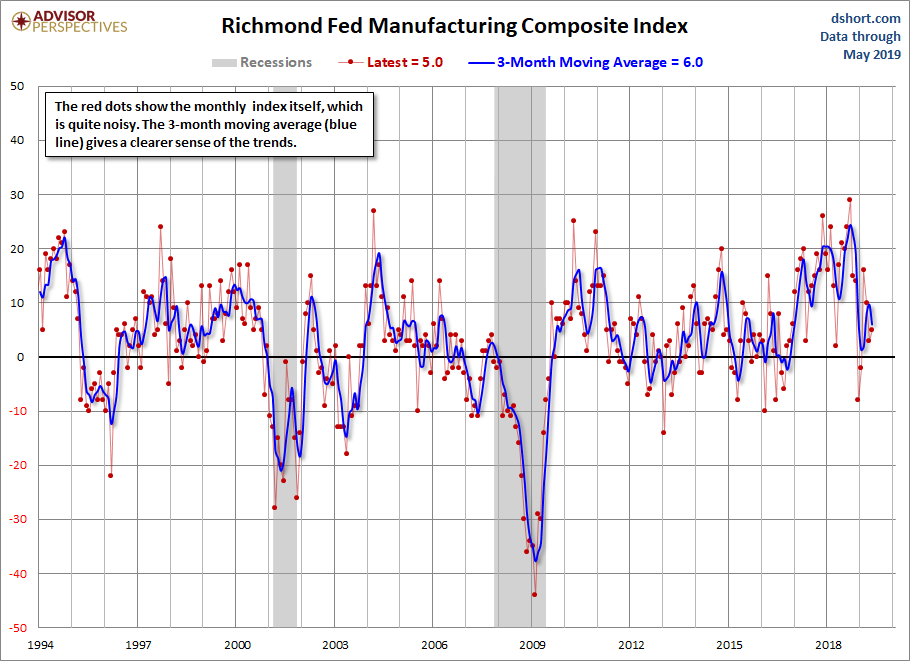
Here is the latest Richmond Fed manufacturing overview.
Fifth District manufacturing activity was moderate in May, according to the most recent survey from the Federal Reserve Bank of Richmond. The composite index inched up from 3 in April to 5 in May, as shipments and new orders had fairly flat reading and the third component, employment, remained positive. Firms reported growth in spending and positive overall business conditions and remained optimistic about growth in the coming months.
Survey results indicated that employment and wages grew in May, while the indicator for average workweek recovered from its negative April reading. However, firms continued to struggle to find workers with the necessary skills as this index dropped from −8 in April to −20 in May. Respondents expected this struggle to continue but to see further growth in employment and wages in the next six months.
The growth rates of both prices paid and prices received fell in May, as growth of prices paid continued to outpace growth of prices received. Firms expected a slight increase in both growth rates in the near future. Link to Report
Here is a somewhat closer look at the index since the turn of the century.
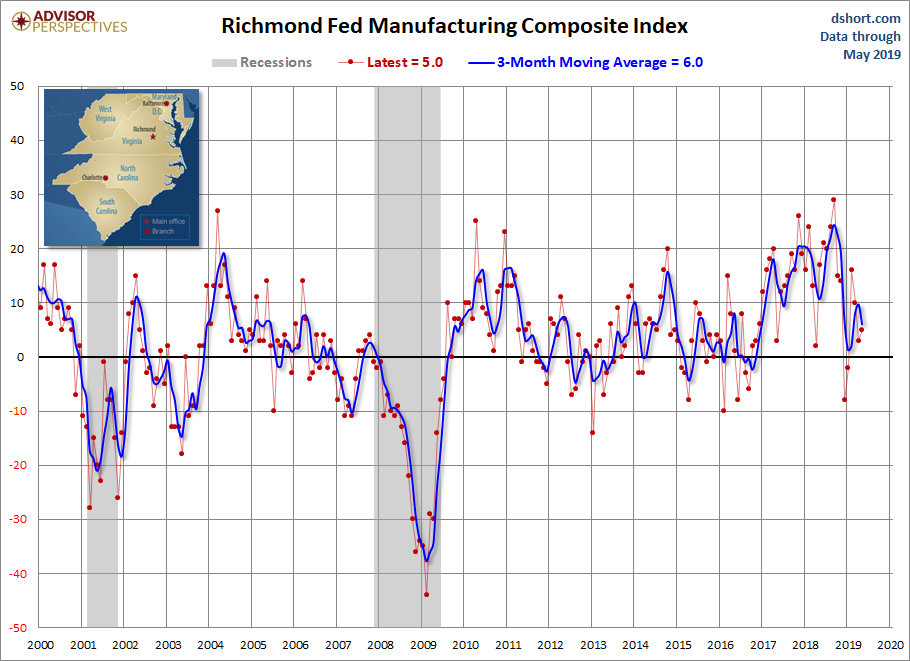
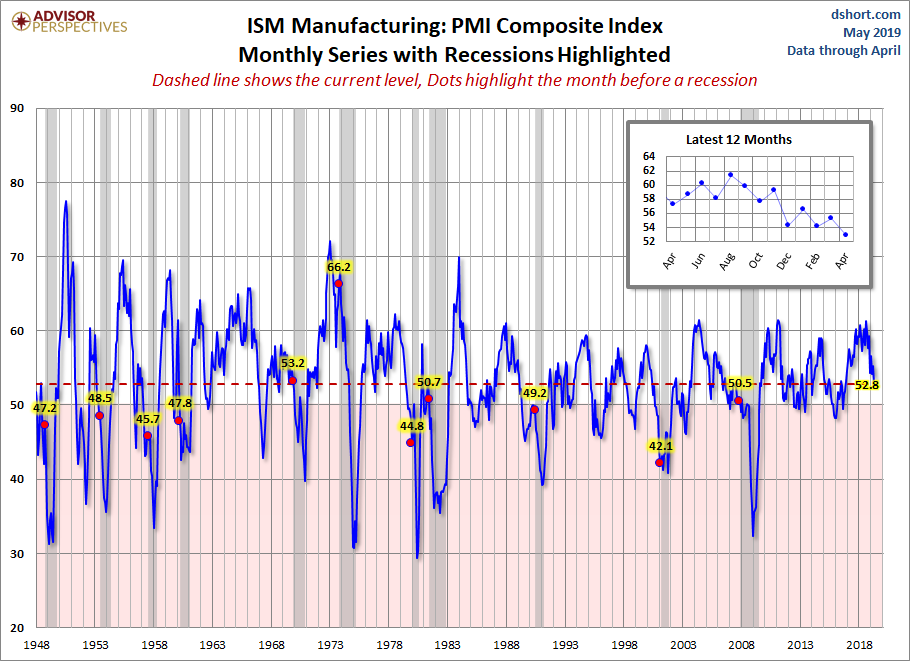
Is today's Richmond composite a clue of what to expect in the next PMI composite? We'll find out when the next ISM Manufacturing survey is released (below).
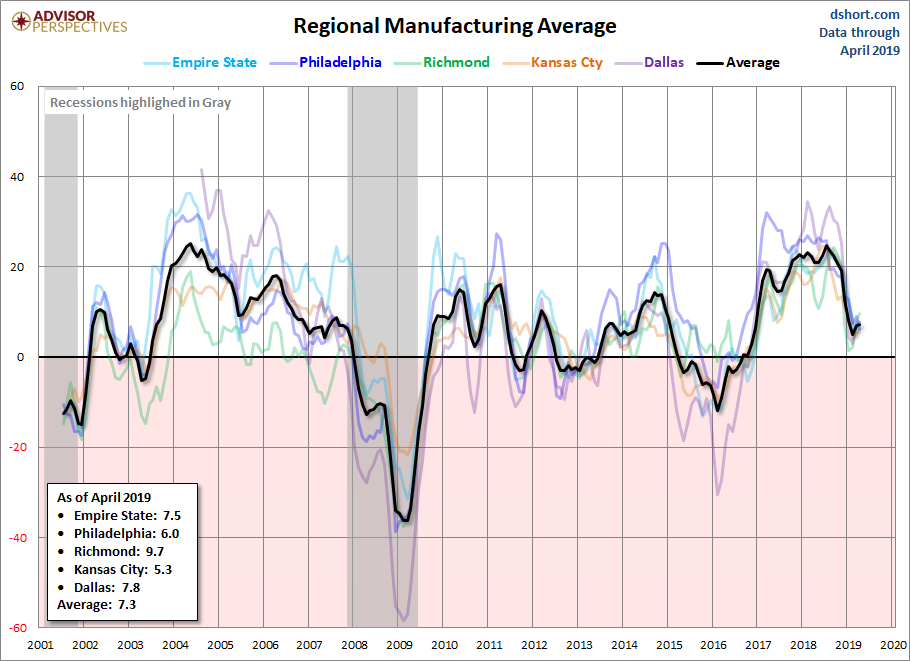
Let's compare all five Regional Manufacturing indicators. Here is a three-month moving average overlay of each since 2001 (for those with data).
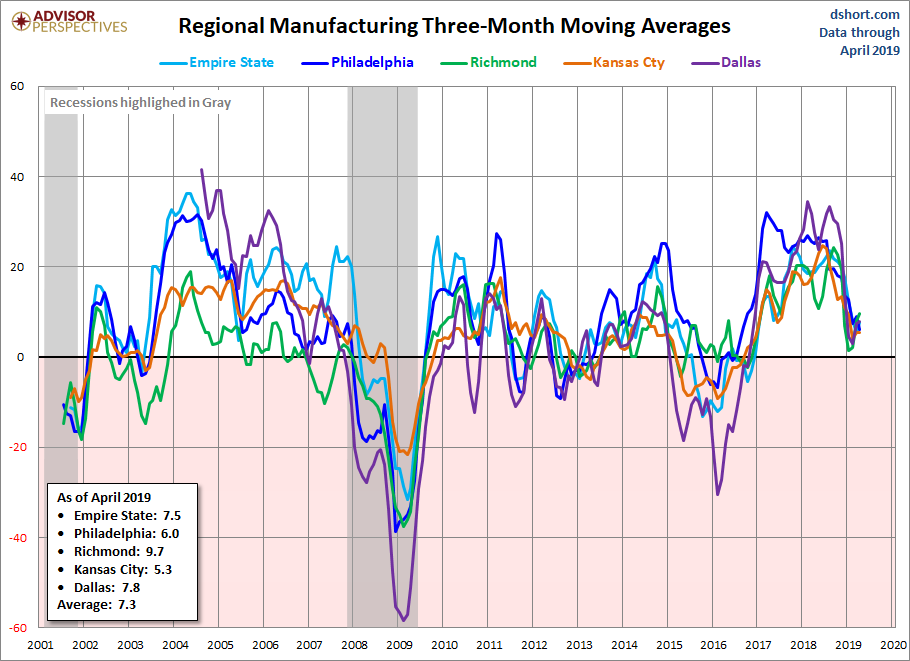
Here is the same chart including the average of the five.



Comments
Log in or sign up to join the conversation.