

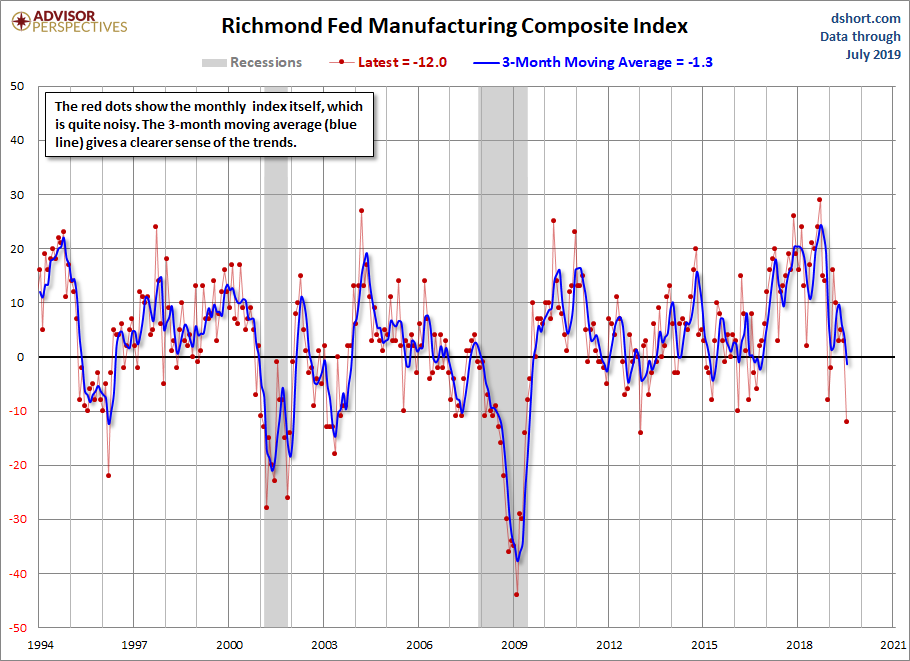
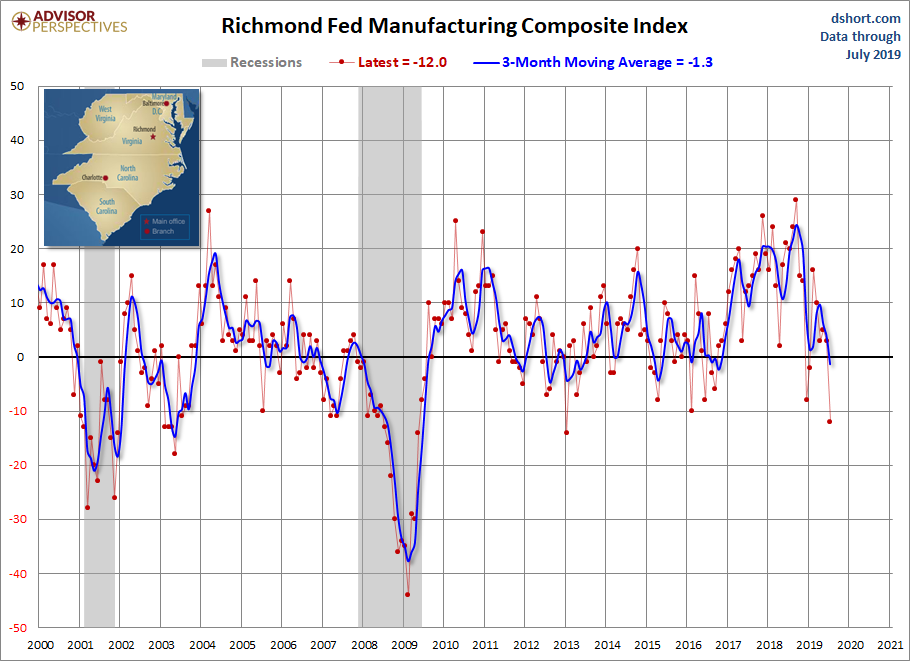
Today the Richmond Fed Manufacturing Composite Index decreased to -12 for the month of July, down from last month's 3. Investing.com had forecast 5. Because of the highly volatile nature of this index, we include a 3-month moving average to facilitate the identification of trends, now at 6.0, which indicates expansion. The complete data series behind today's Richmond Fed manufacturing report, which dates from November 1993, is available here.
Here is a snapshot of the complete Richmond Fed Manufacturing Composite series.
(Click on image to enlarge)
Here is the latest Richmond Fed manufacturing overview.
Fifth District manufacturing activity weakened in July, according to the most recent survey from the Richmond Fed. The composite index fell from 2 in June to −12 in July, its lowest reading since January 2013, as all three components — shipments, new orders, and employment — registered declines. Backlogs of orders also fell, reaching a value of −26, its lowest reading since April 2009. Firms reported worsening local business conditions, as this index dropped from 7 to −18, its largest one-month drop on record. However, respondents were optimistic that conditions would improve in the coming months.
Survey results indicated that employment and the average workweek declined in July. However, wage growth continued among survey respondents. Firms continued to struggle to find workers with the necessary skills and expect that struggle to continue in the next six months.
The growth rates of both prices paid and prices received rose in July, as growth of prices paid outpaced that of prices received. Survey participants, on average, expected growth of both prices paid and prices received to slow in the near future. Link to Report
Here is a somewhat closer look at the index since the turn of the century.
(Click on image to enlarge)
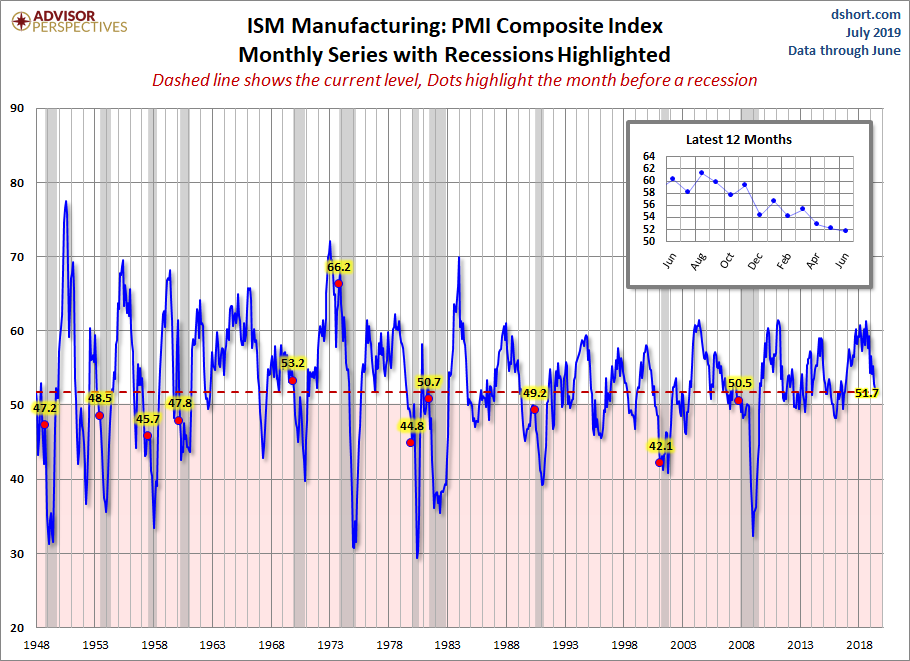
Is today's Richmond composite a clue of what to expect in the next PMI composite? We'll find out when the next ISM Manufacturing survey is released (below).
(Click on image to enlarge)
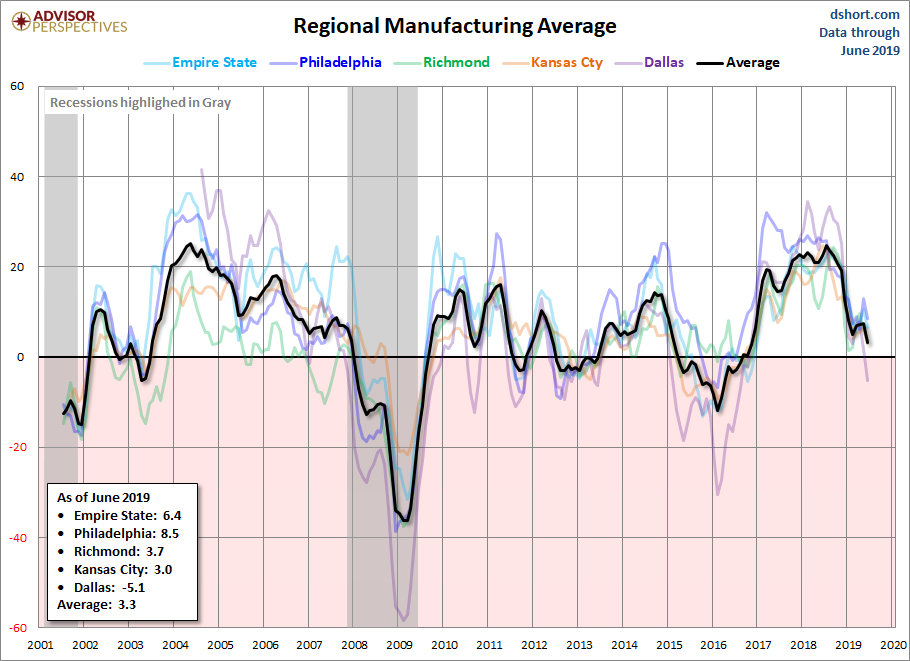
Let's compare all five Regional Manufacturing indicators. Here is a three-month moving average overlay of each since 2001 (for those with data).
(Click on image to enlarge)
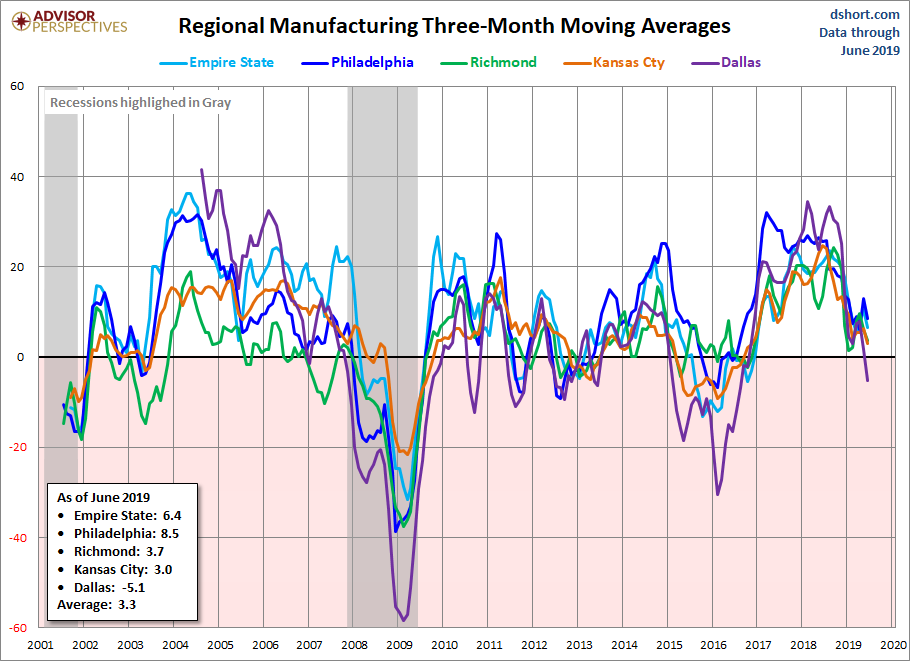
Here is the same chart including the average of the five.
(Click on image to enlarge)



Comments
Log in or sign up to join the conversation.