

The Philadelphia Fed yesterday posted the results of a revision of both coincident and leading indices, as explained here. The resulting plot for California, Kansas, Minnesota, Wisconsin and the US is shown below.
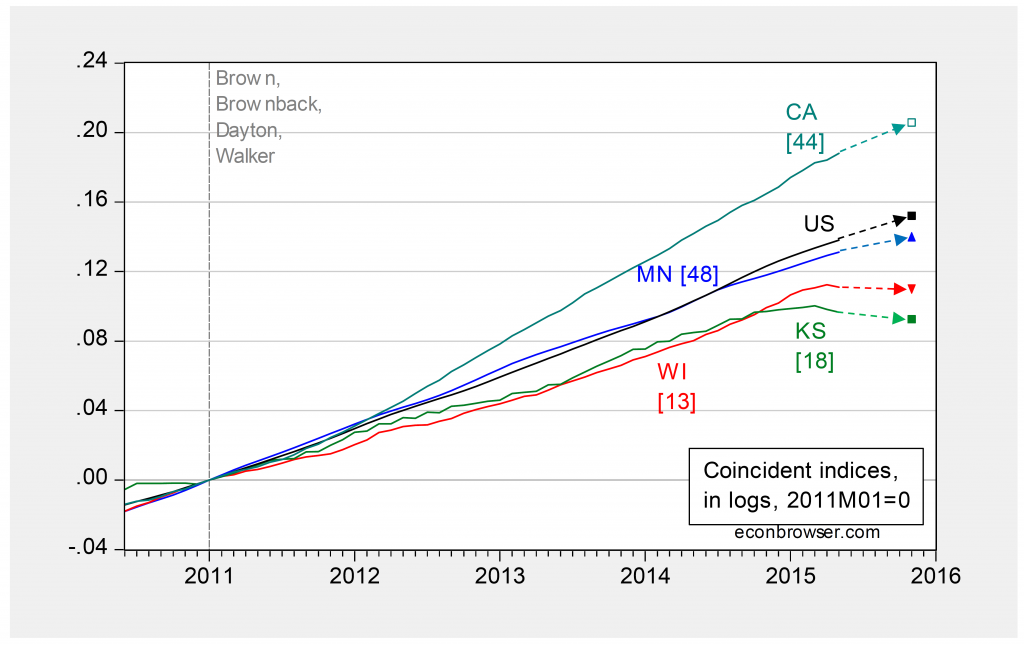
Figure 1: Coincident indices for Minnesota (blue), Wisconsin (red), Kansas (green), California (teal), and the US (black), all in logs, normalized to 2011M01=0. Observations for 2015M11 are log-levels implied by leading indices. Numbers in [brackets] are ALEC-Laffer-Moore-Williams rankings for 2015. Source: Philadelphia Fed, ALEC, Rich States Poor States, 2015, and author’s calculations.
The 2% cumulative growth gap since 2011M01 between Wisconsin and Minnesota is forecasted to grow to 3% by November 2015.
Notice the negative correlation between ALEC rankings and outlook (and recent performance), which is a manifestation of this pattern. Noah Smith discusses this lack of correlation between ALEC rankings and actual outcomes.


Comments
Log in or sign up to join the conversation.