

The Census Bureau's Advance Retail Sales Report for December was released this morning. Headline sales came in at -0.7% month-over-month to one decimal and was below the Investing.com forecast of -0.2%. Core sales (ex Autos) came in at -1.4% MoM.
Here is the introduction from today's report:
Statement Regarding COVID-19 Impact: Due to recent events surrounding COVID-19, many businesses are operating on a limited capacity or have ceased operations completely. The Census Bureau has monitored response and data quality and determined estimates in this release meet publication standards. For more information on the compilation of this month's report, see COVID-19 FAQs.
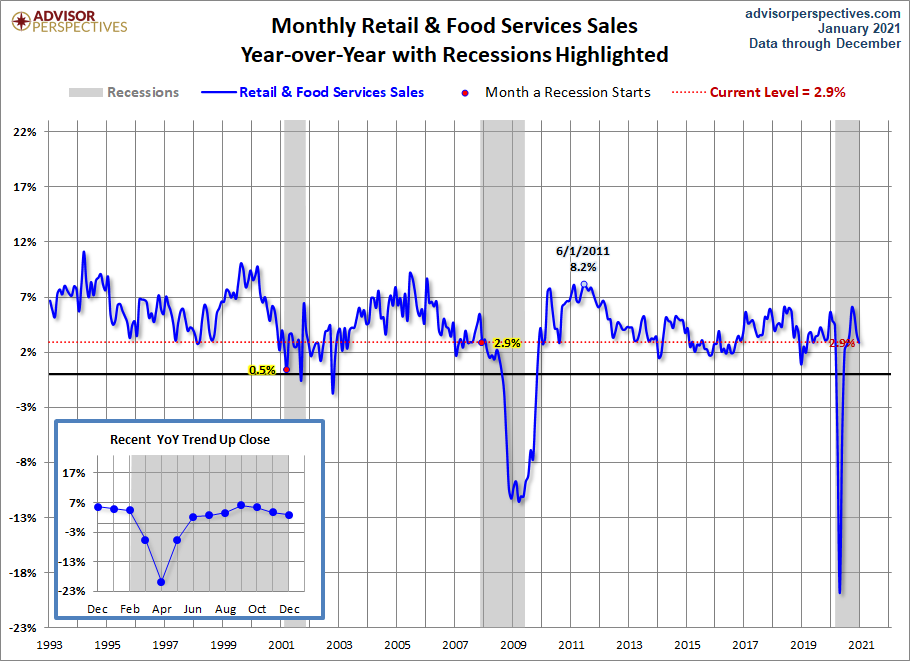
Advance estimates of U.S. retail and food services sales for December 2020, adjusted for seasonal variation and holiday and trading-day differences, but not for price changes, were $540.9 billion, a decrease of 0.7 percent (±0.5 percent) from the previous month, but 2.9 percent (±0.7 percent) above December 2019. Total sales for the 12 months of 2020 were up 0.6 percent (±0.4 percent) from 2019. Total sales for the October 2020 through December 2020 period were up 4.0 percent (±0.5 percent) from the same period a year ago. The October 2020 to November 2020 percent change was revised from down 1.1 percent (±0.5 percent) to down 1.4 percent (±0.2 percent).
Retail trade sales were down 0.3 percent (±0.5 percent)* from November 2020, but 6.3 percent (±0.7 percent) above last year. Nonstore retailers were up 19.2 percent (±1.6 percent) from December 2019, while food services and drinking places were down 21.2 percent (±3.7 percent) from last year. [view full report]
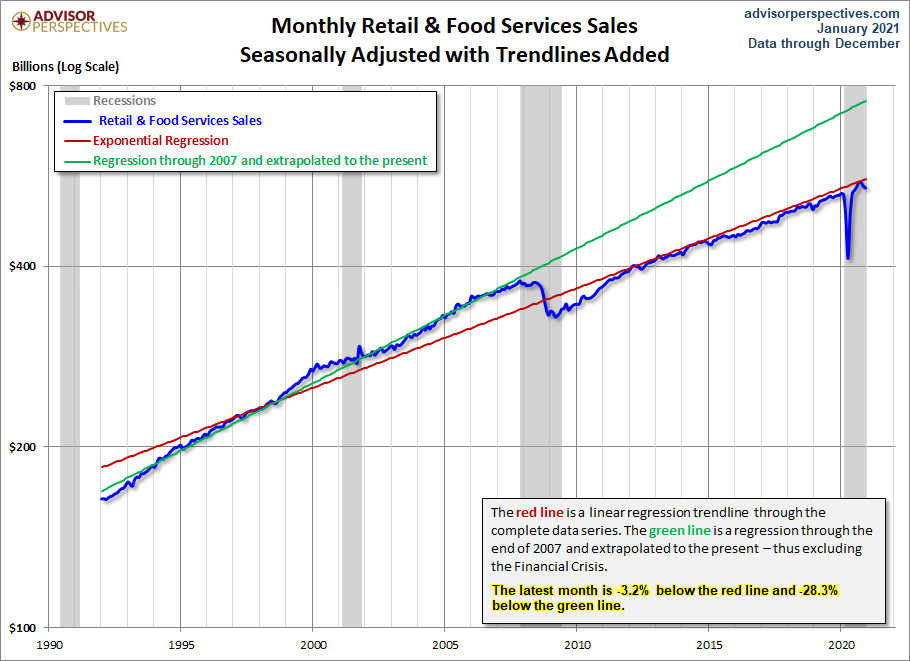
The chart below is a log-scale snapshot of retail sales since the early 1990s. The two exponential regressions through the data help us to evaluate the long-term trend of this key economic indicator.
The year-over-year percent change provides another perspective on the historical trend. Here is the headline series.
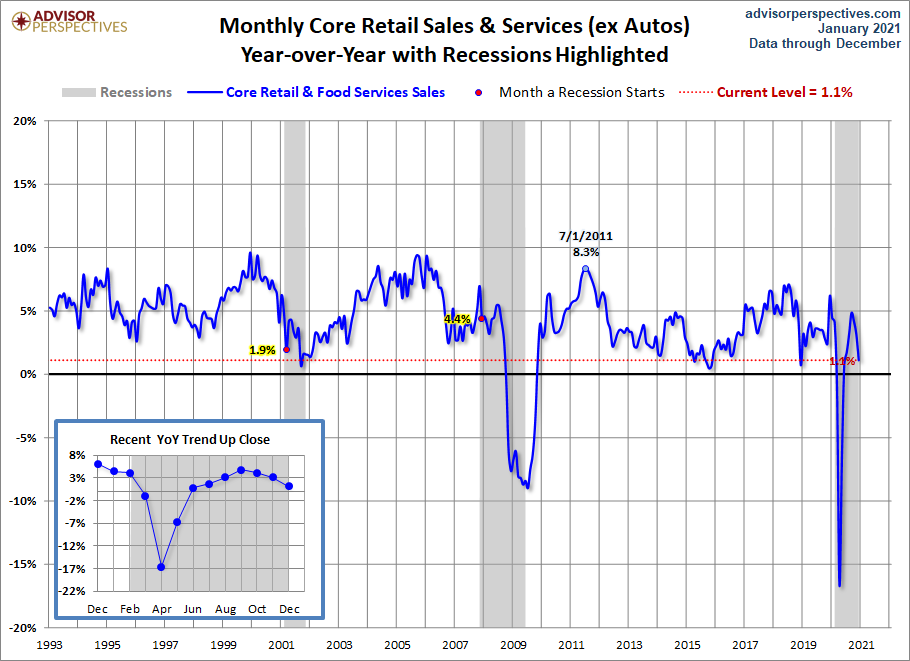
Core Sales
Here is the year-over-year version of Core Retail Sales.
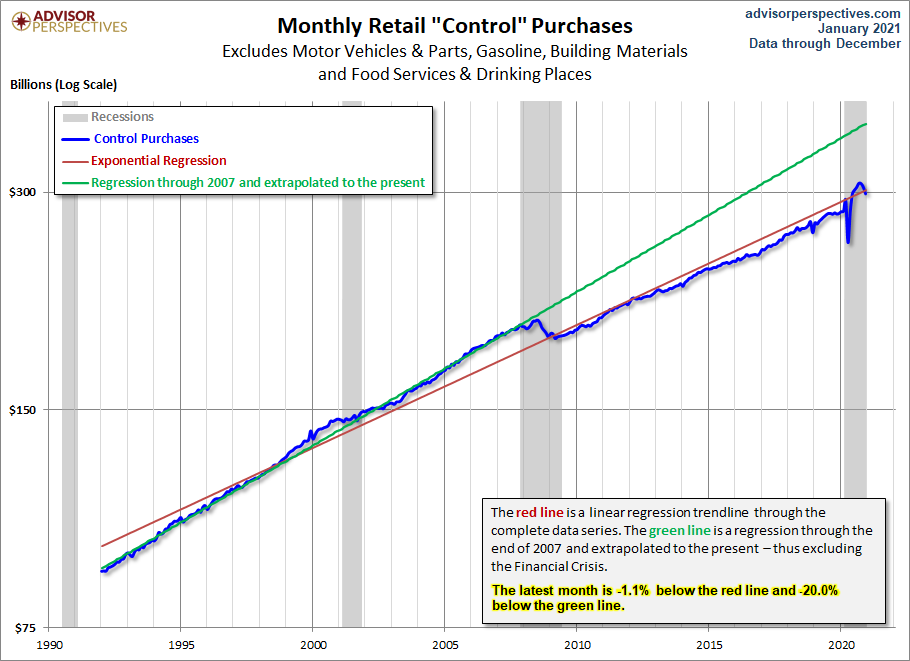
“Control” Purchases
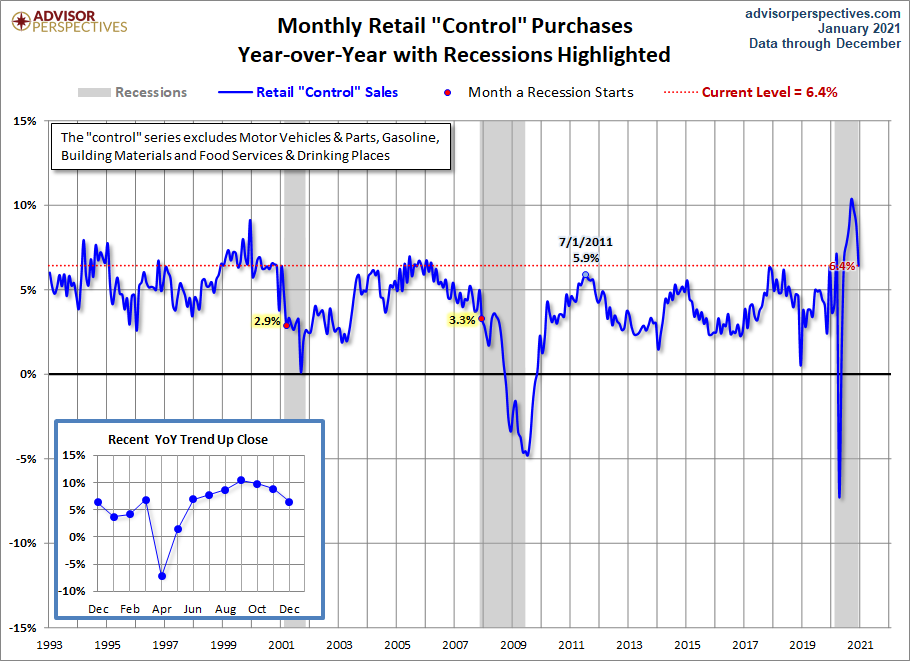
The next two charts illustrate retail sales “Control” purchases, which is an even more “Core” view of retail sales. This series excludes Motor Vehicles & Parts, Gasoline, Building Materials as well as Food Services & Drinking Places. The popular financial press typically ignores this series, but it a more consistent and reliable reading of the economy.
Here is the same series year-over-year.
For a better sense of the reduced volatility of the “Control” series, here is a YoY overlay with the headline retail sales.
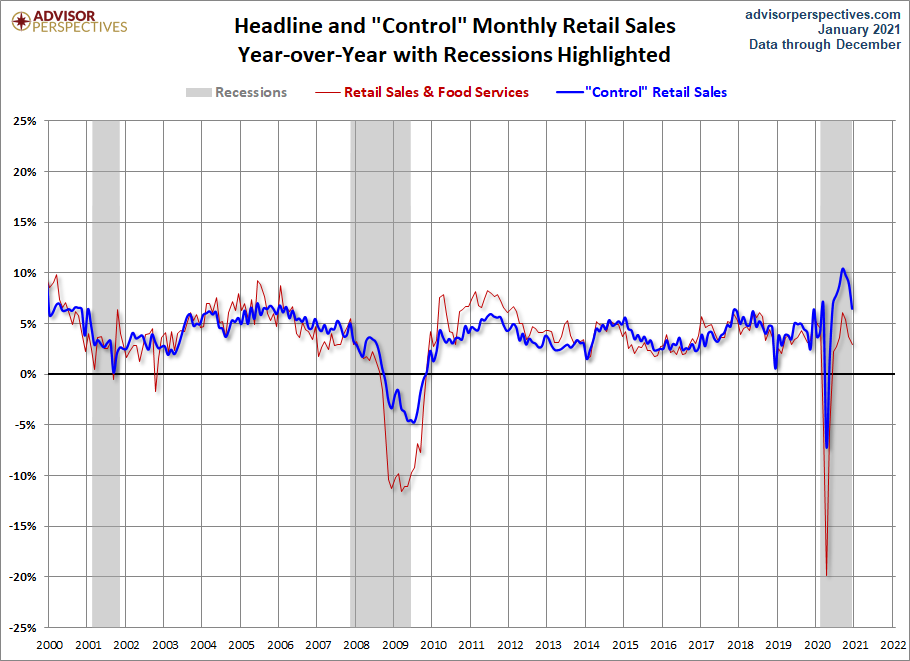
Bottom Line: December headline and core sales were down and worse than forecasts. Later today, we'll take a closer look at Real Retail Sales.



Comments
Log in or sign up to join the conversation.