

This was one of the slowest weeks I can remember in seeing new economic data released. In my usual weekly economic highlight, I try to hone in on an element which is positively or negatively affecting the economy. Recently, data which would indicate increases in the rate of economic expansion have been very hard to find.

This week the most significant data release to me was the U.S. Census data on the residential building sector. In the "olden" days, residential building was a major element driving GDP growth. With new residential construction still around half of the pre-Great Recession peak, it is an important but no longer significant element of GDP. (click on below graphic to enlarge).

Residential construction continues to show a moderately declining rate growth rate for both building permits and construction completions.
Unadjusted 3 Month Rolling Average of Year-over-Year Growth - Building Permit (blue line) and Construction Completions (red line)

The reason we believe these two data points are important is that they show the beginning of the residential building process and the end of the process. Accelerating future growth in residential construction would be shown as higher growth in permits versus the growth rate of residential construction completions as shown on the above graphic. Another way to look at this situation would be to simply subtract construction completions from permits issued (graph below).
Difference Between New Home Building Permits and Construction Completions (unadjusted)
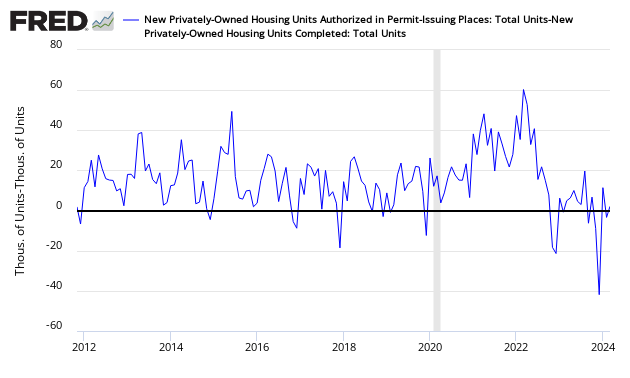
There is seasonality in simply subtracting completions from permits. However, standing back from the data, there was a general improvement trend since the Great Recession. It is difficult to tell at this point if this trend is still continuing using the method of simply subtracting completions from permits.
The positive aspect of analyzing this series is that inflation does not apply as it counts the permits and completions. The negative aspect of this series is that there is significant backward revision so the current month's data can be very inaccurate. Also the nature of this industry naturally varies from month to month so the rolling averages are the best way to view this series - and still the data remains in the range we have seen over the last 3 years.
Yet the data for September 2015 showed a continued decline in the rate of year-over-year growth for both permits and completions. Why?
One answer may be that household formation and construction completions may have finally harmonized (using data since 1997).
| year | new households created | residential construction completions | running difference |
| 2014 | 770 | 883 | 63 |
| 2013 | 1375 | 765 | -50 |
| 2012 | 2402 | 641 | 560 |
| 2011 | 1144 | 585 | 2321 |
| 2010 | 357 | 654 | 2880 |
| 2009 | 398 | 796 | 2583 |
| 2008 | 772 | 1127 | 2185 |
| 2007 | 1627 | 1514 | 1830 |
| 2006 | 1041 | 1989 | 1943 |
| 2005 | 1343 | 1929 | 995 |
| 2004 | 722 | 1835 | 409 |
| 2003 | 1981 | 1677 | -704 |
| 2002 | 1088 | 1646 | -400 |
| 2001 | 3504 | 1565 | -958 |
| 2000 | 831 | 1579 | 981 |
| 1999 | 1346 | 1603 | 233 |
| 1998 | 1510 | 1473 | -24 |
| 1997 | 1391 | 1404 | 13 |
Source: Statista, U.S. Census
The above data begs the question whether household formations may be significantly slowing recently which reduces demand for homes.
I would not take the data I have seen from U.S. Census on construction completions and permits to the bank yet. We need to see several months more of data to make any concrete conclusions.


Comments
Log in or sign up to join the conversation.