

As ETFs have become the investment vehicle of choice for many investors, the ETF industries in the single regions around the globe are enjoying record high inflows and run from one record high in assets under management to another on a monthly basis.
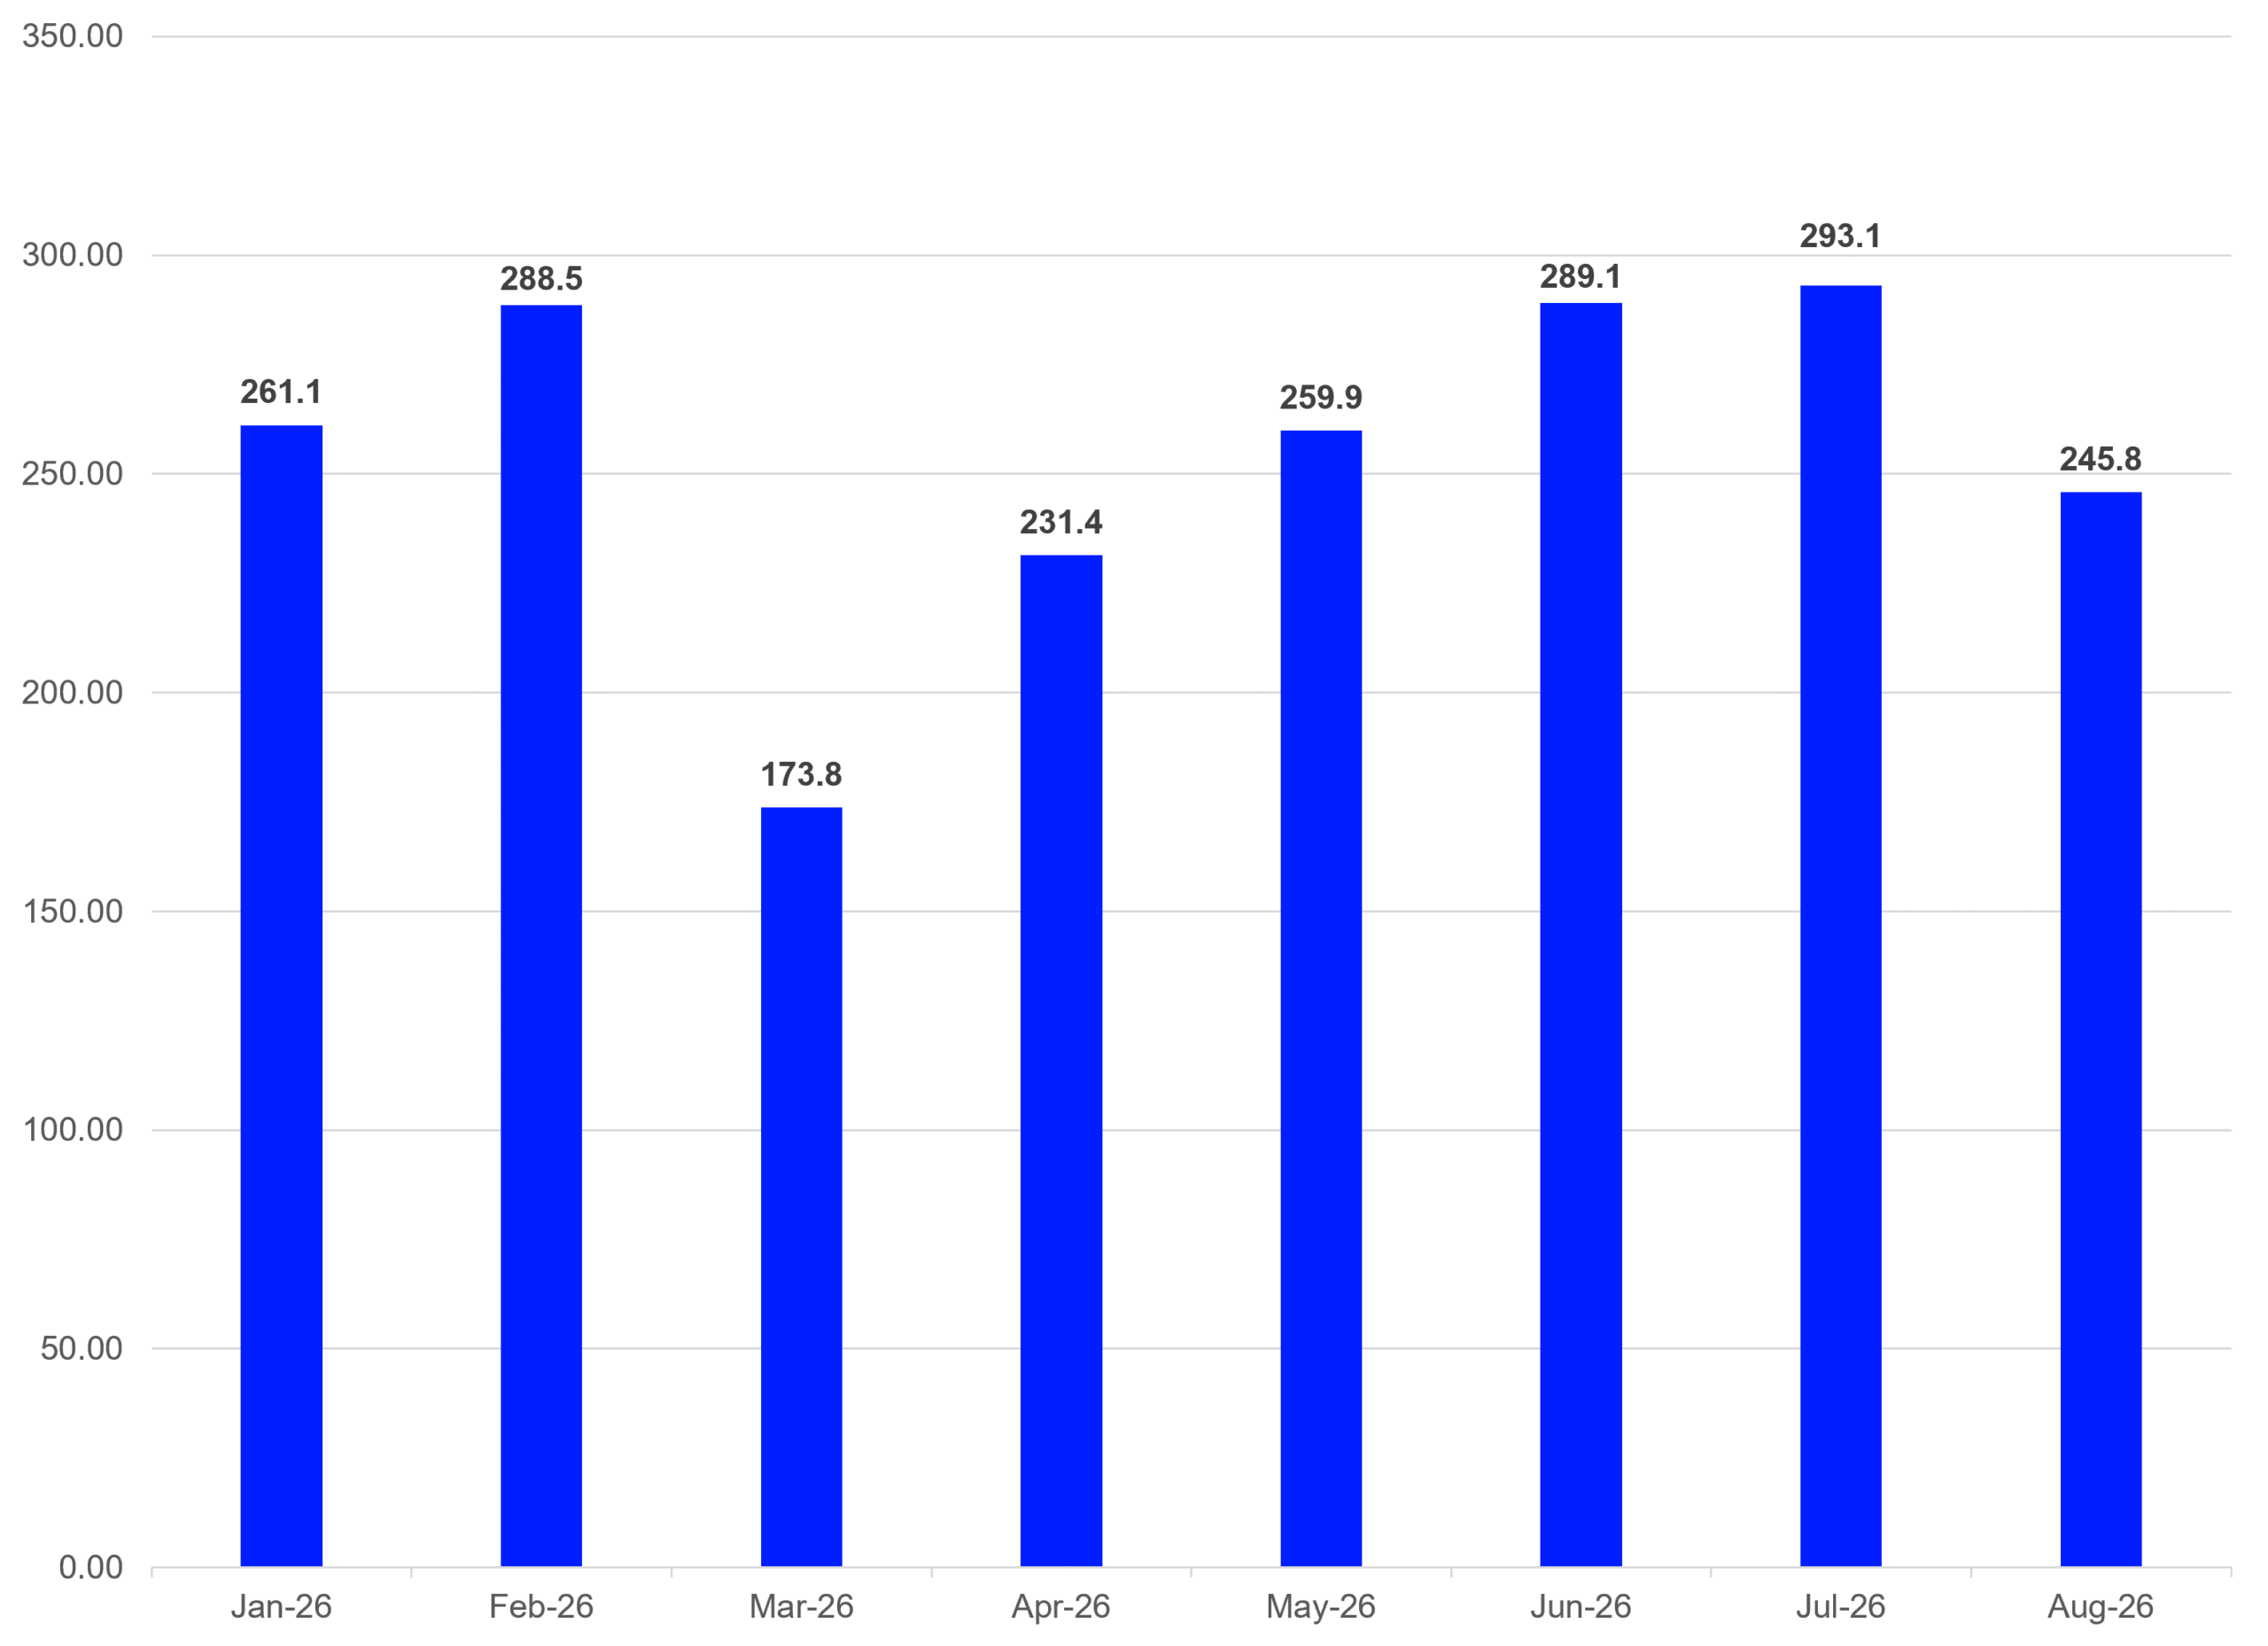
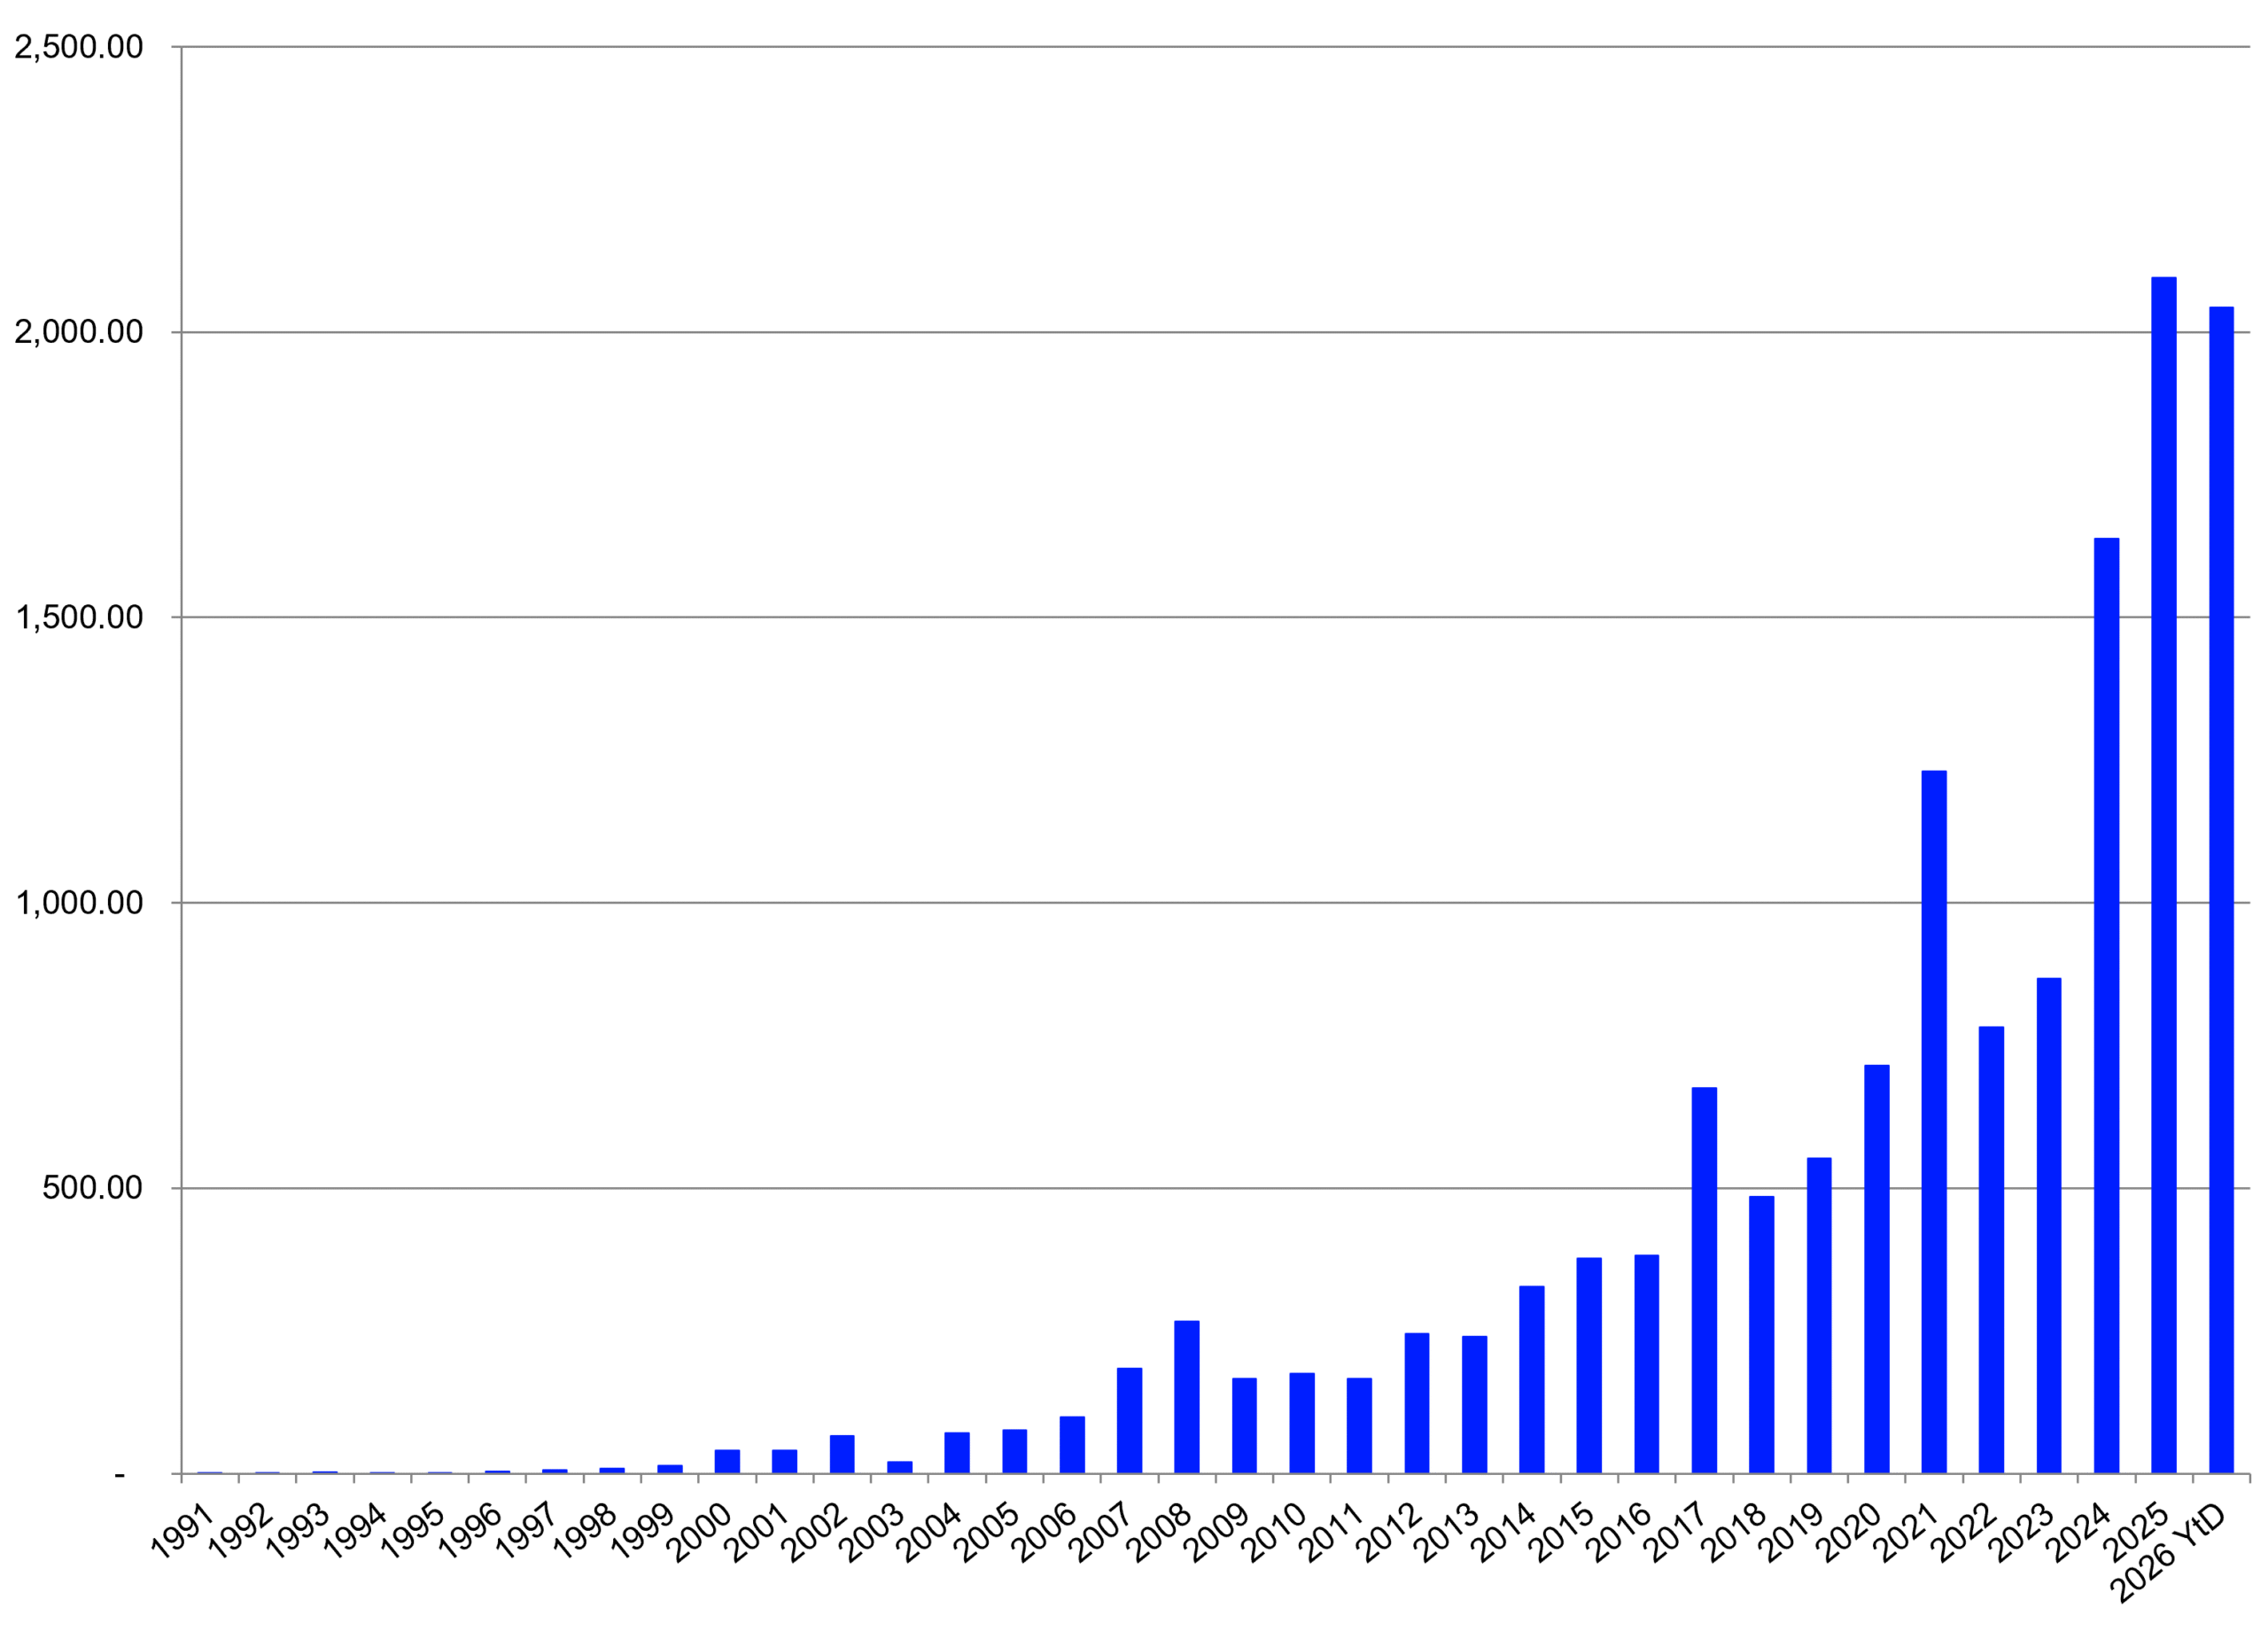
But how are these numbers connected with the past of the global ETF industry? Well, ETFs globally enjoyed average estimated net inflows of $255.3 bn per month over the course of the first eight months of 2026, summing up to estimated net inflows of $2,042.6 bn for 2026 year to date.
Graph 1: Global ETF Industry – Monthly Estimated Net Flows 2026 (in bn USD)
Source: LSEG Lipper
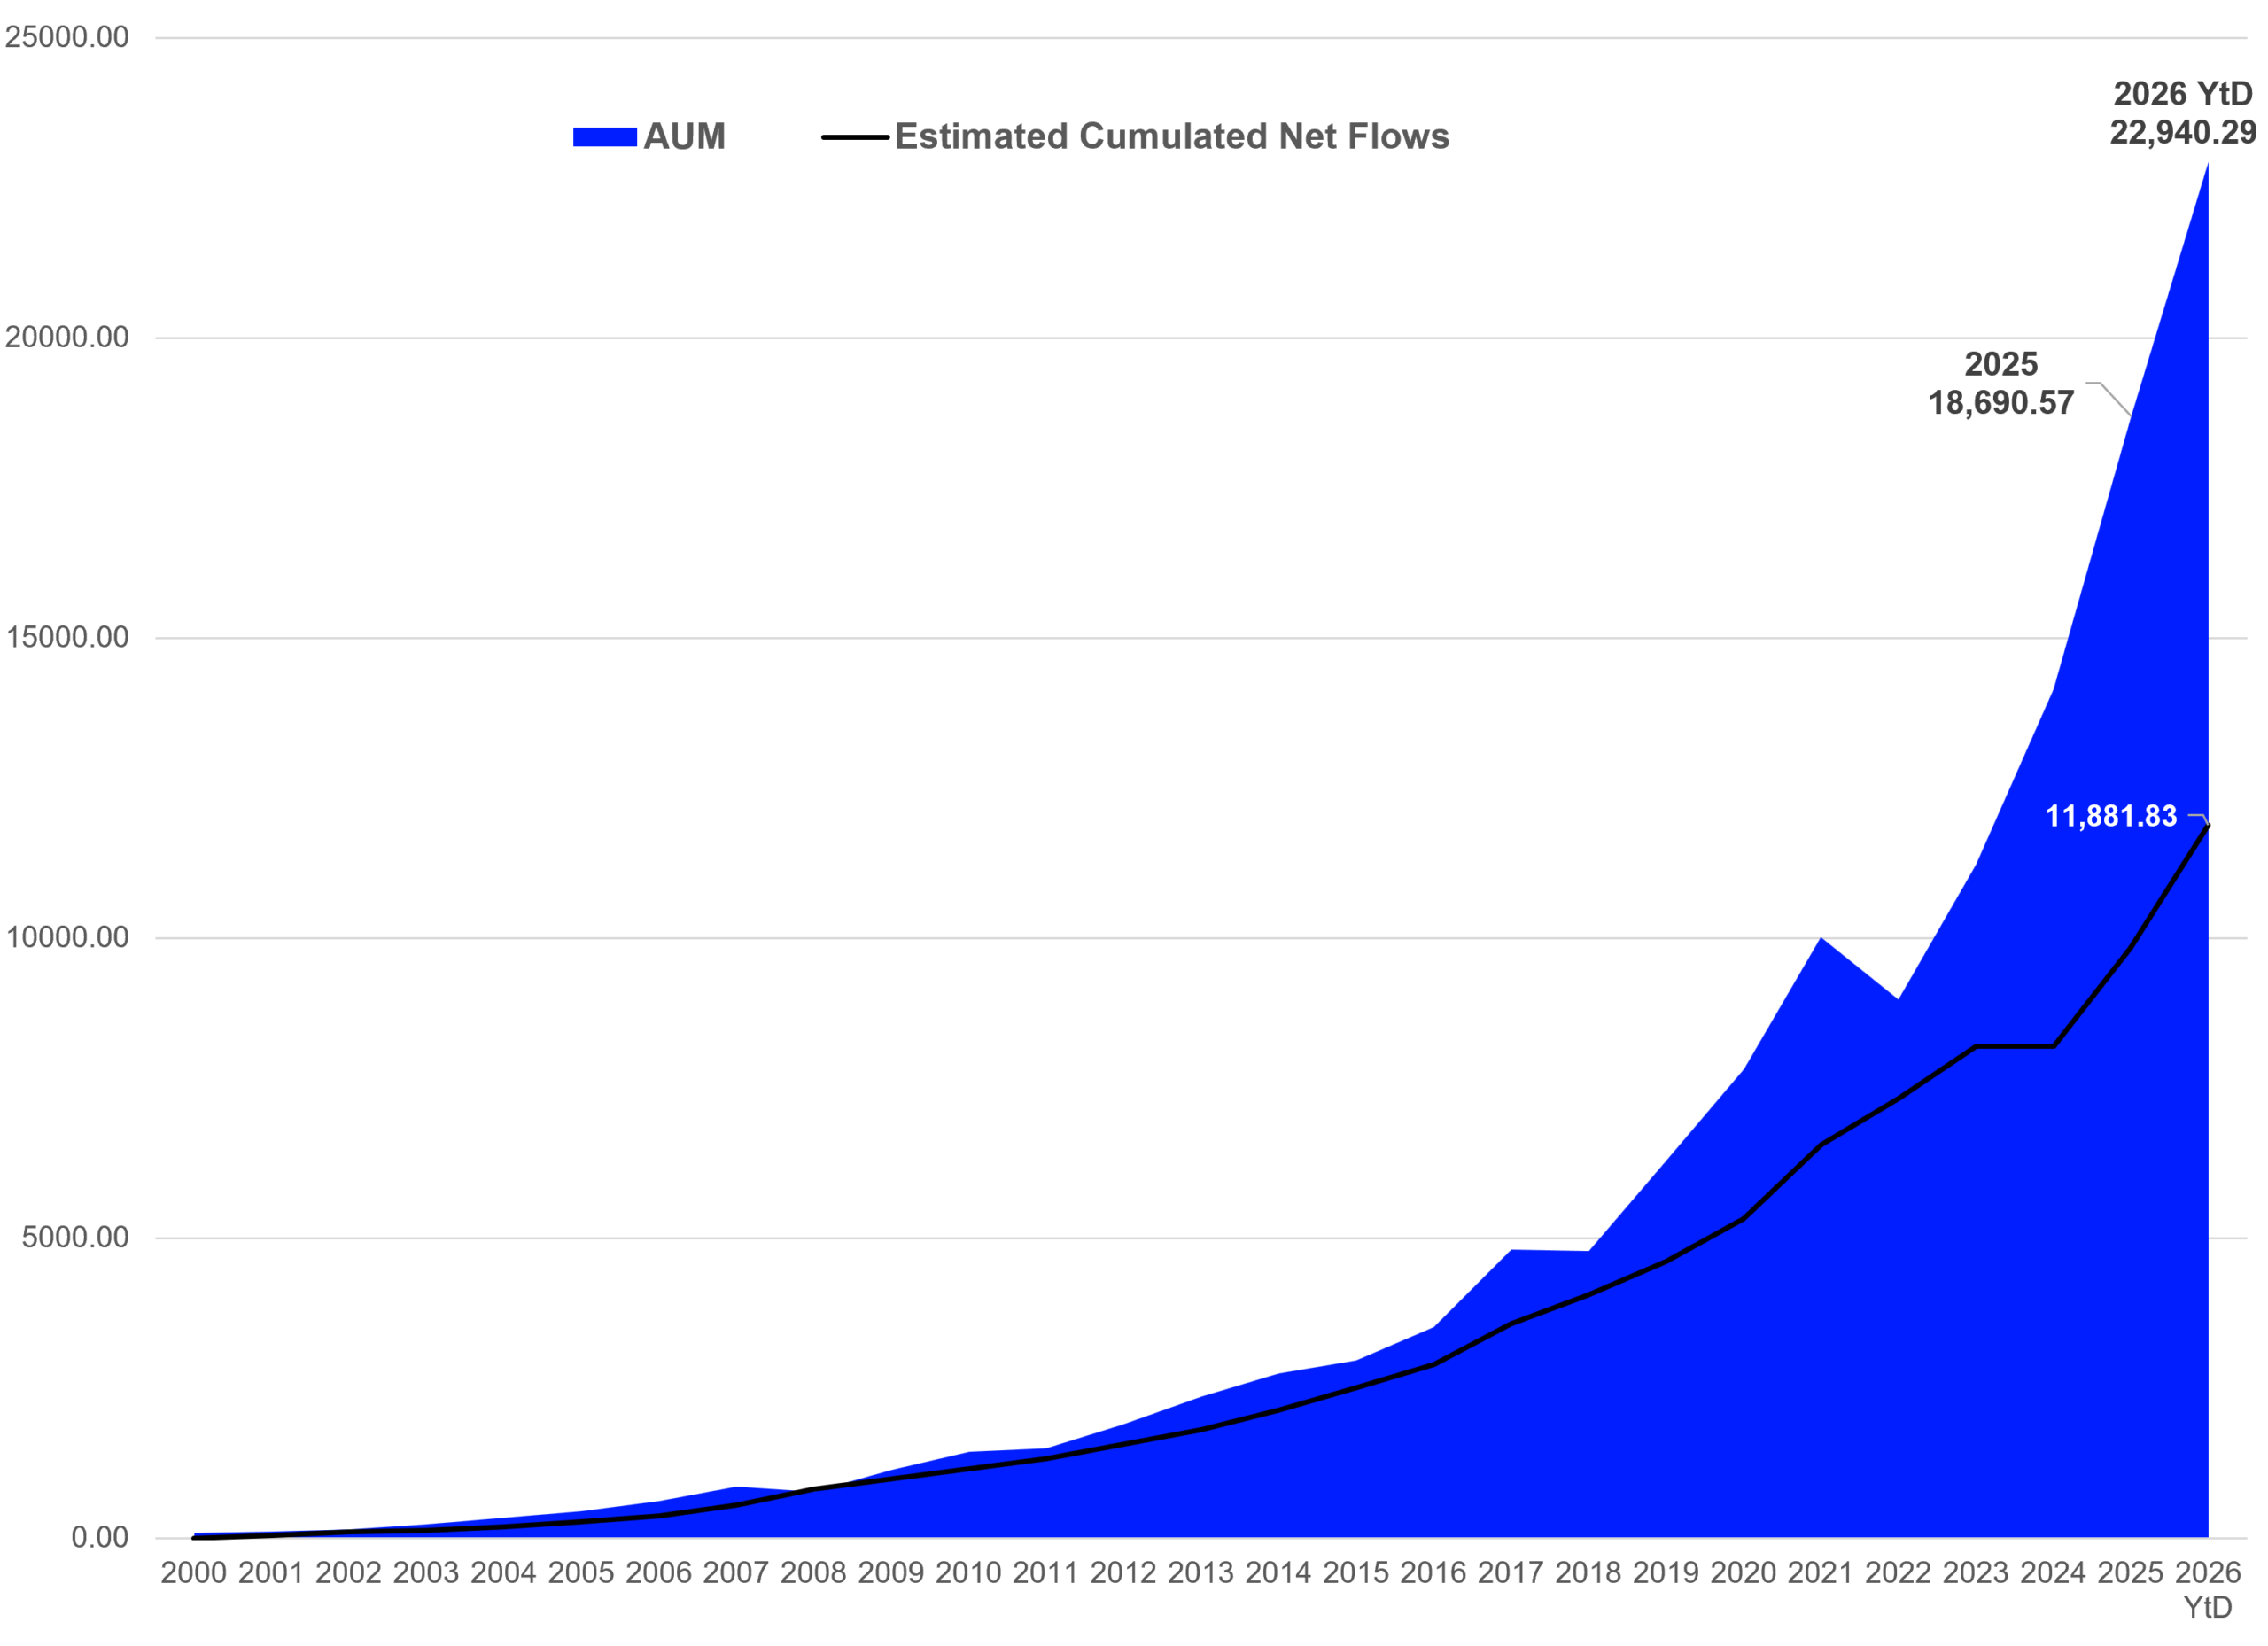
Comparing these numbers with the assets under management shows that the average monthly inflows for 2026 so far are higher than the overall assets under management held by exchange traded funds around the globe in April 2004 ($252.5 bn), while the overall estimated net flows for 2026 so far are higher than the overall assets under management held by ETFs around the globe in February 2013 ($2,003.7 bn).
Graph 2: Assets Under Management and Cumulative Estimated Net Inflows in the Global ETF Industry (in bn USD)
Source: LSEG Lipper
A View of ETFs Domiciled in the U.S.
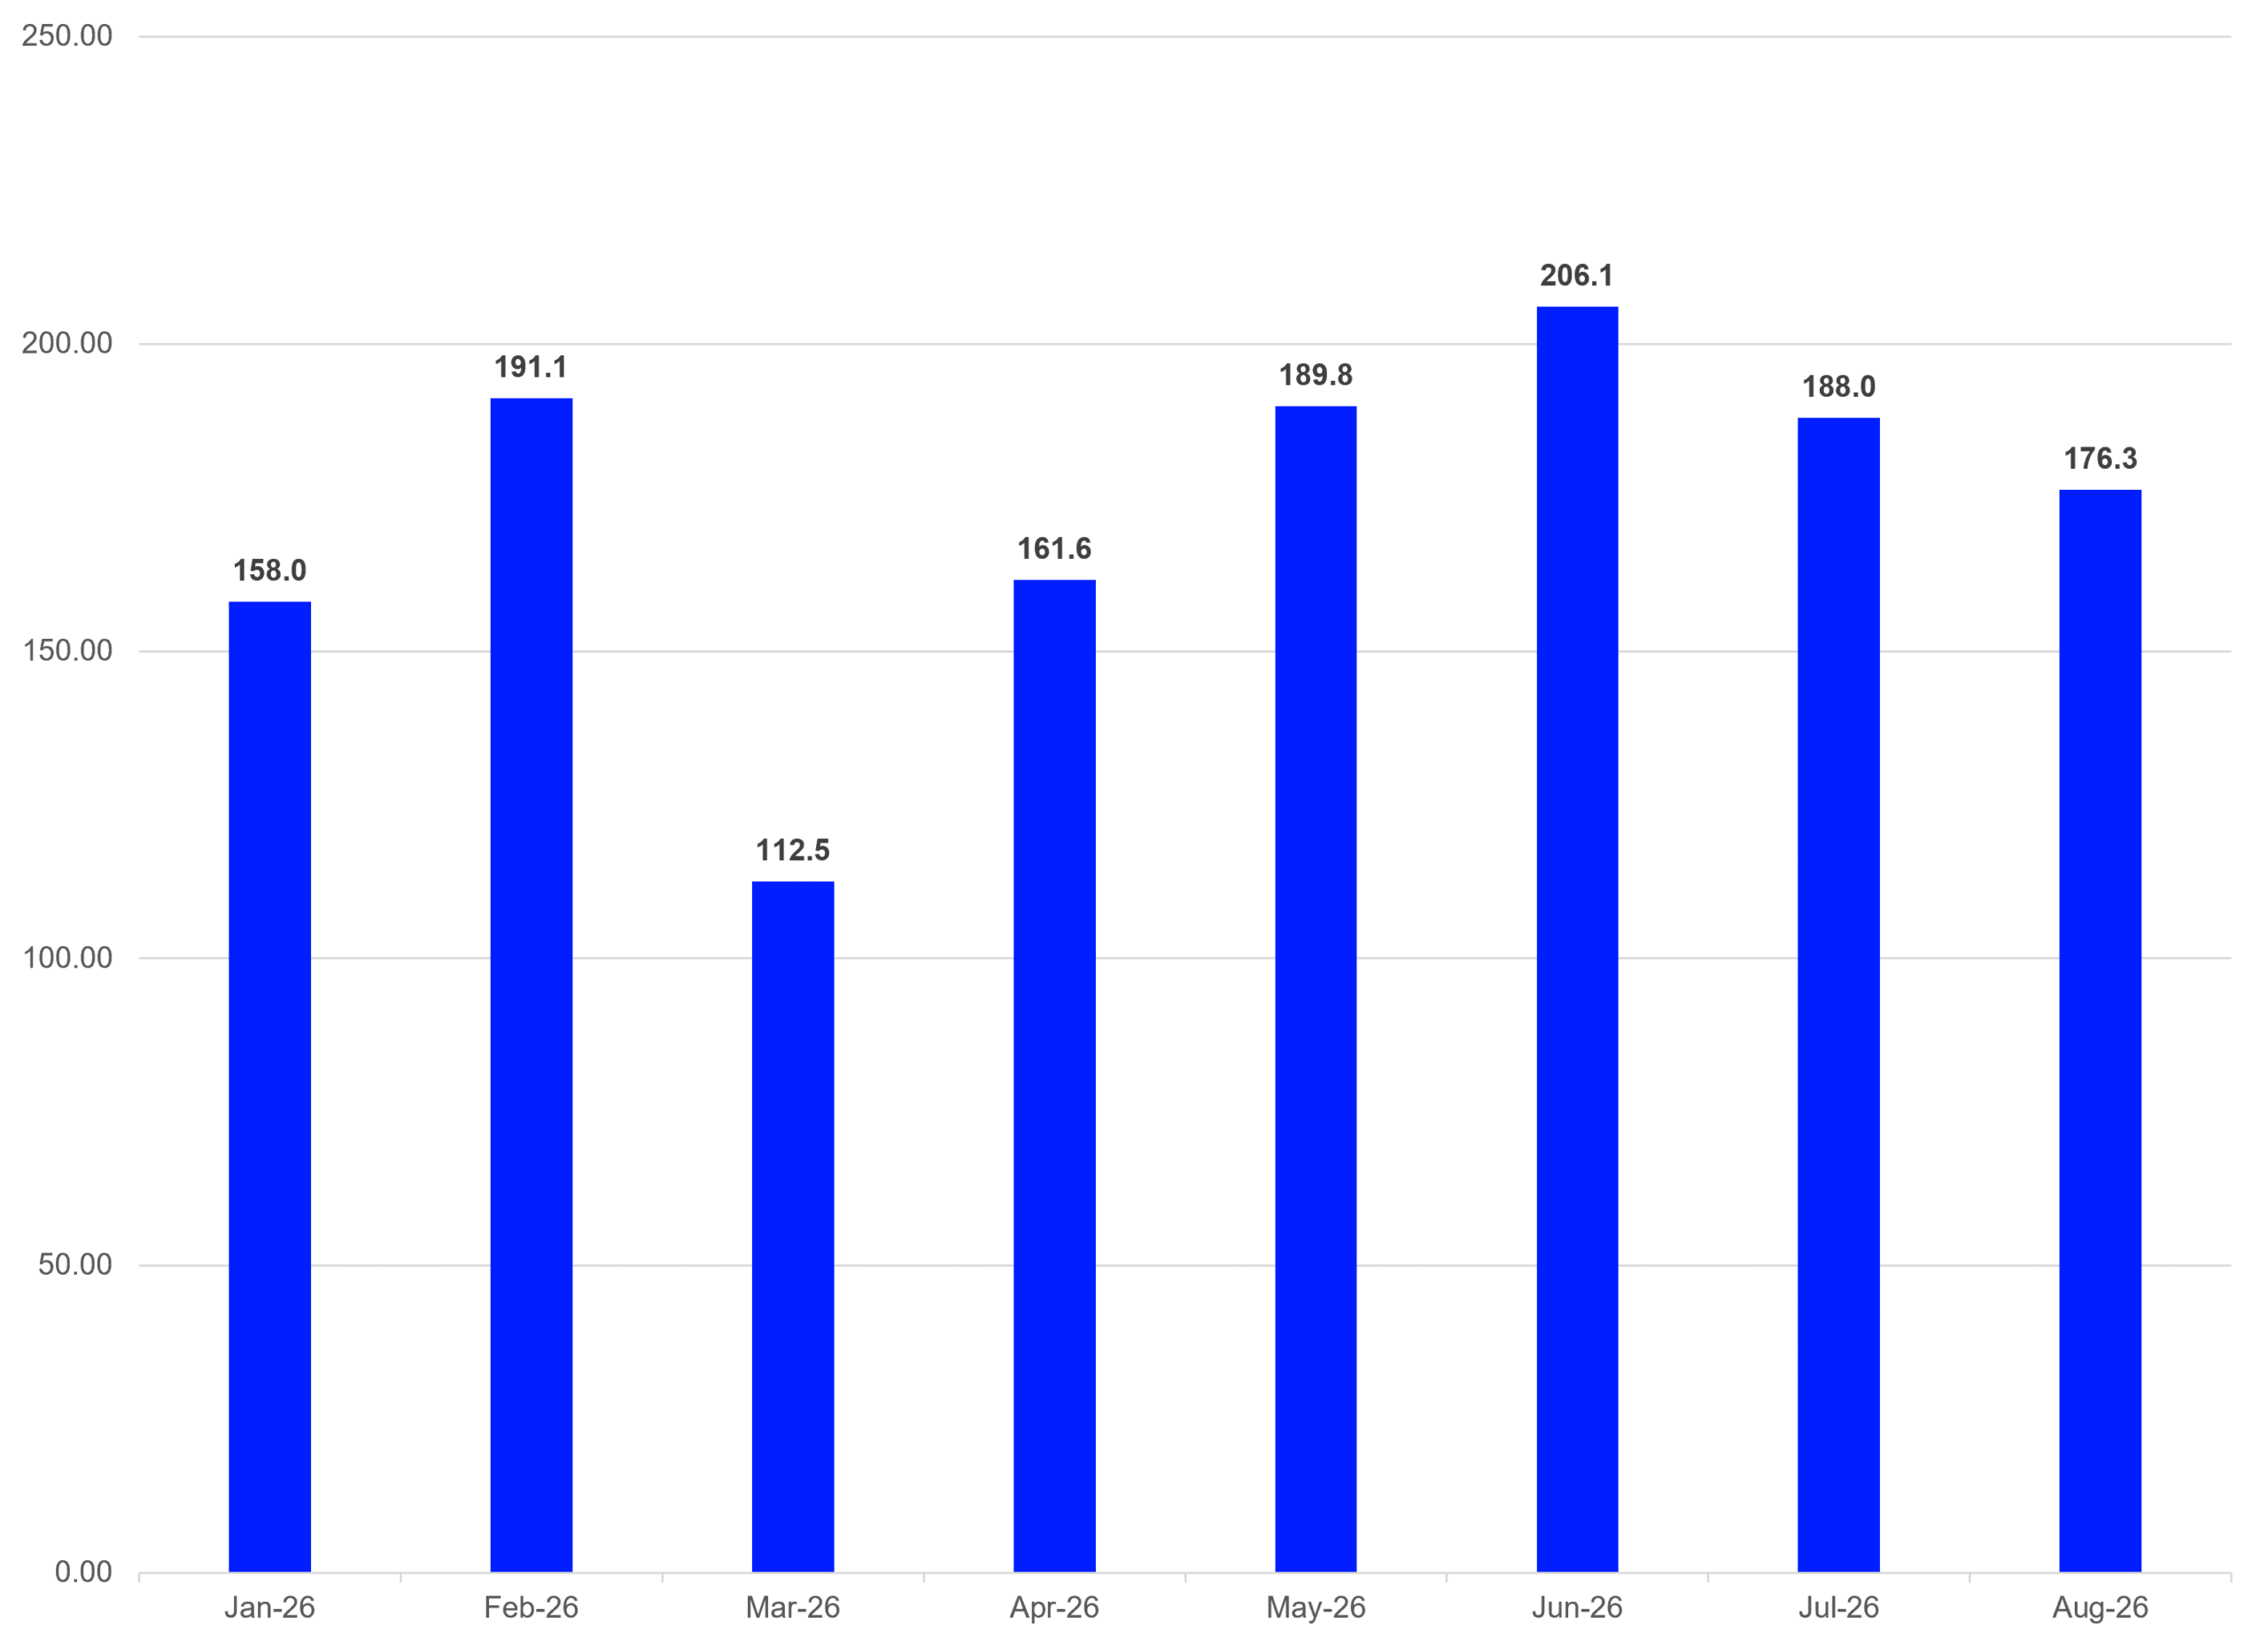
A view of inflows into ETFs in the U.S. shows that these products gathered on average $172.9 bn per month over the course of the first eight months of 2026. These inflows are summing up to estimated net inflows of $1,383.5 bn for 2026 so far.
Graph 3: U.S. ETF Industry – Monthly Estimated Net Flows 2026 (in bn USD)
Source: LSEG Lipper
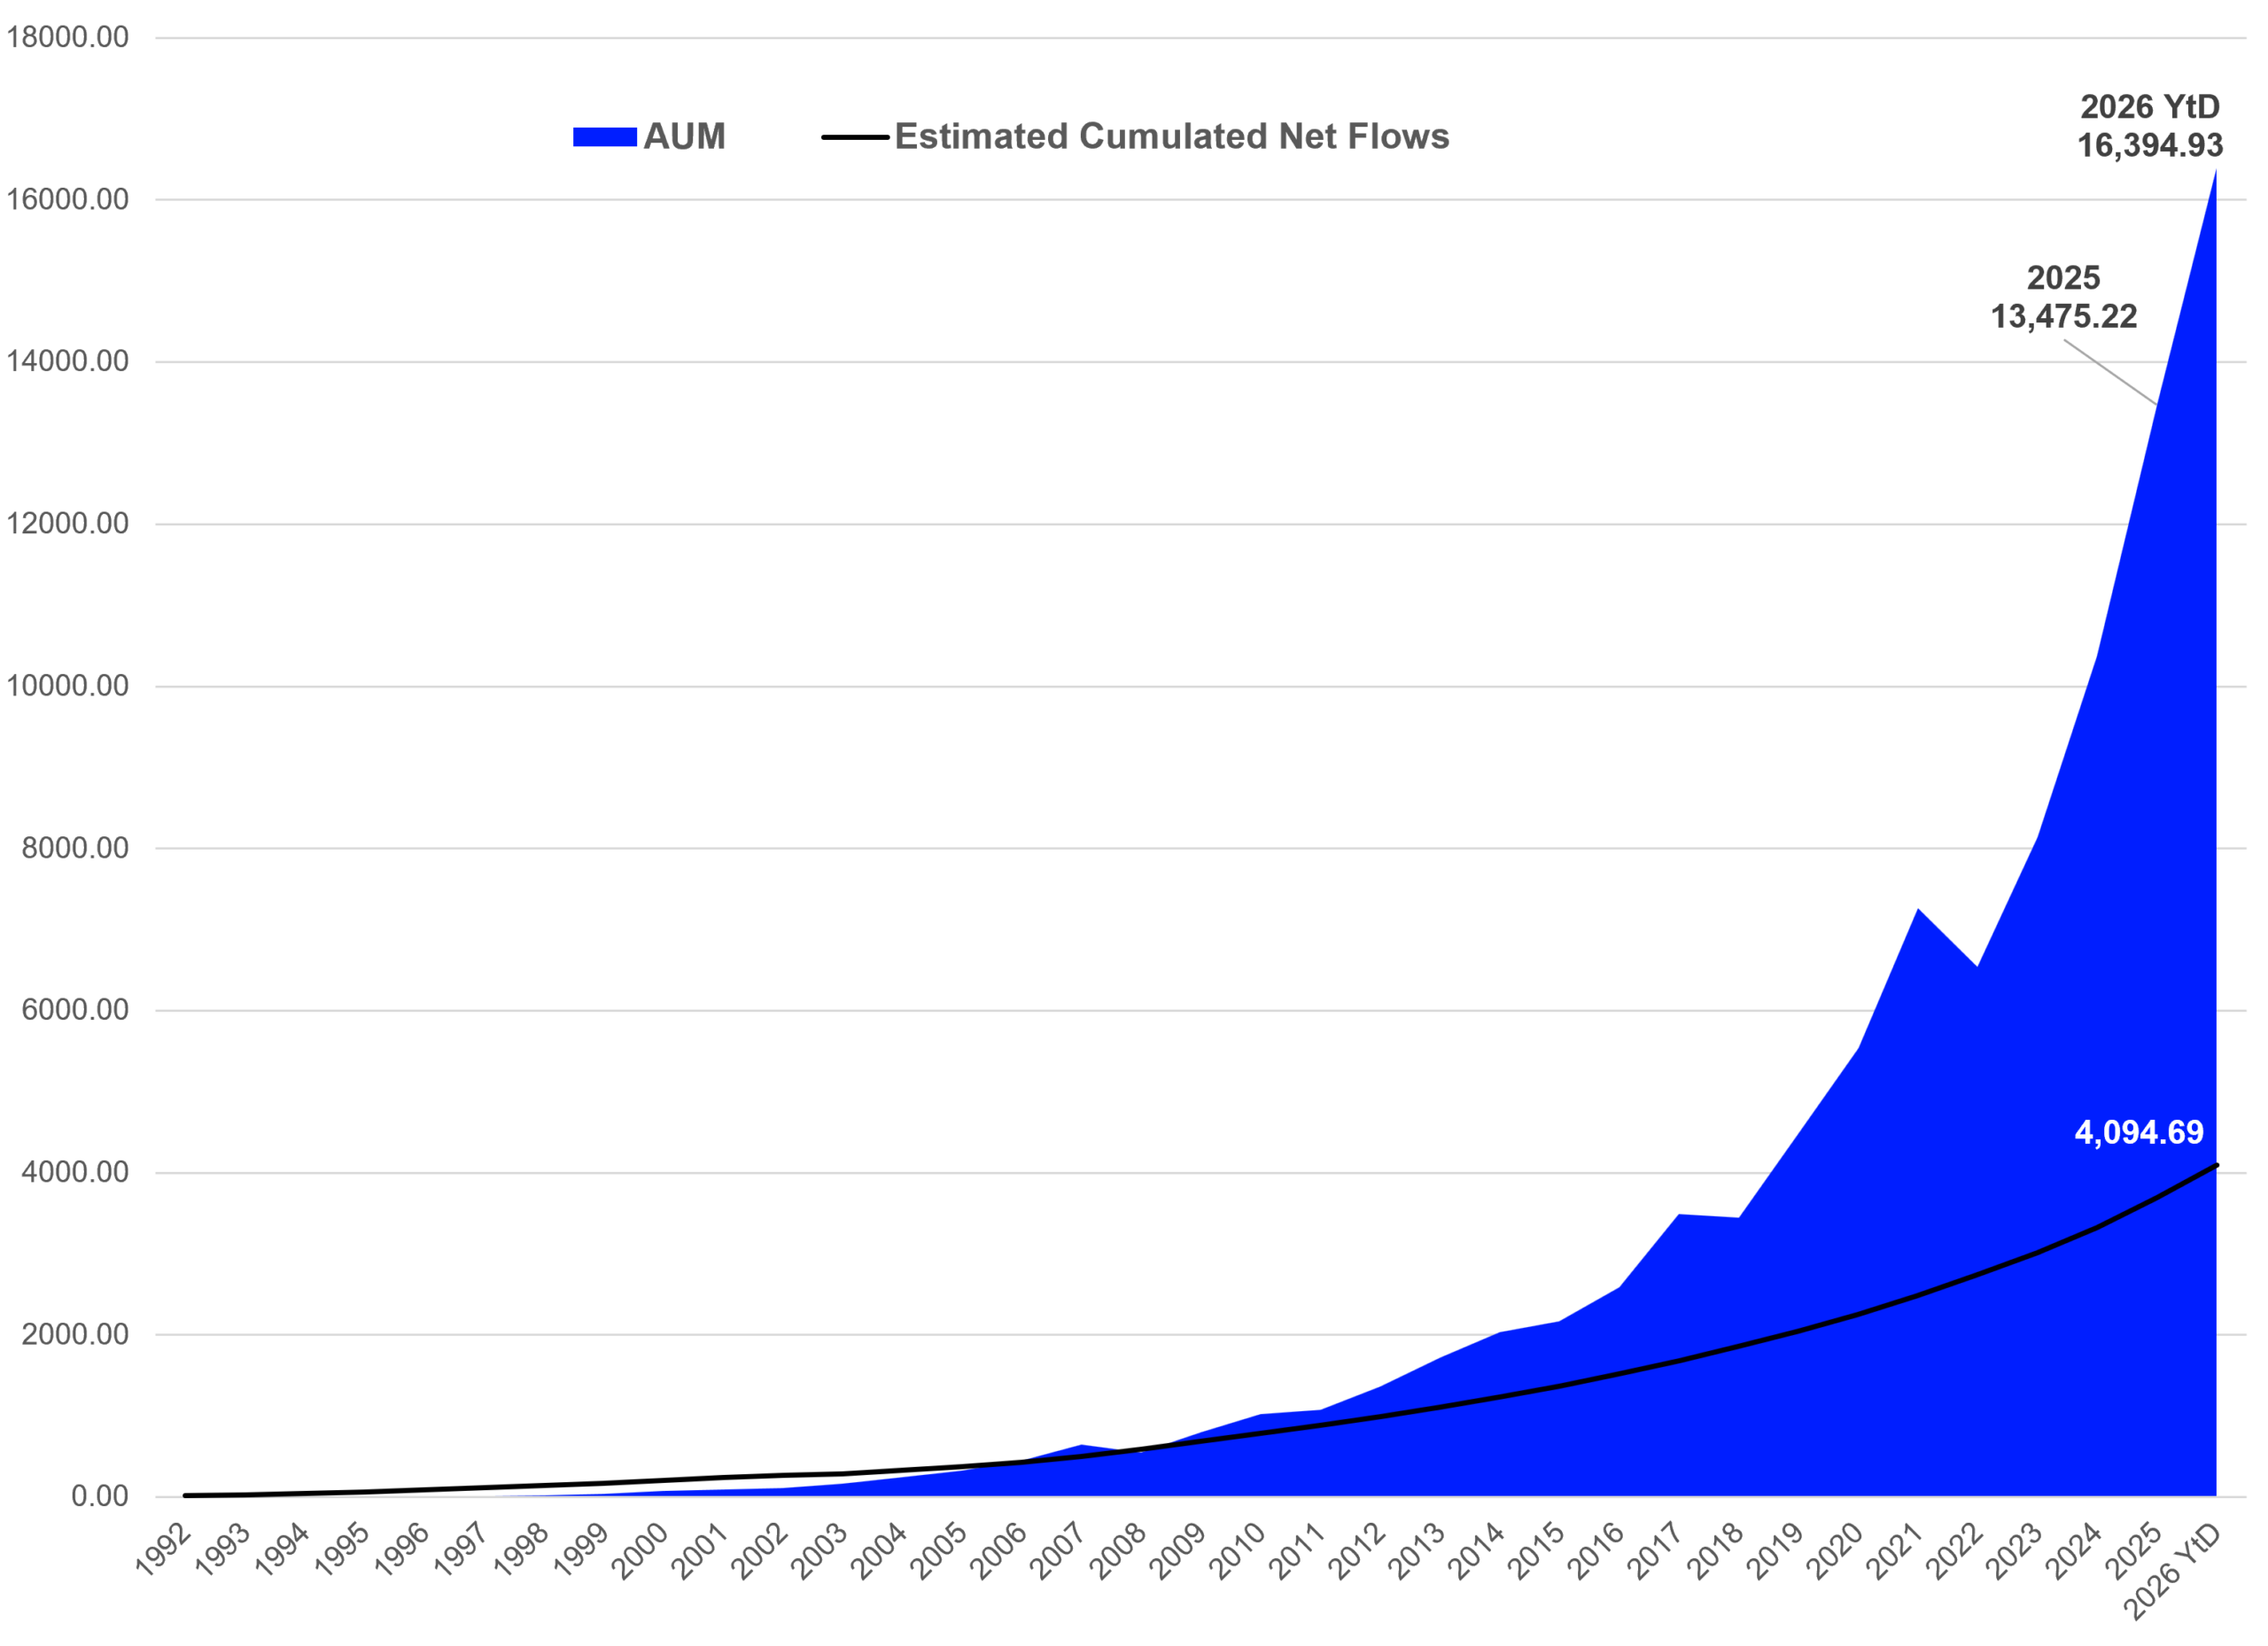
Given the fact that the U.S. ETF industry is the major growth driver for the global ETF industry, it is not surprising that the current inflows into ETFs domiciled in the U.S. were higher than the overall assets under management held by ETFs in November 2003 ($157.0 bn), while the overall estimated net flows for 2026 so far are higher than the overall assets under management held by U.S. domiciled ETFs in November 2012 ($1,349.2 bn).
Graph 4: Assets Under Management and Cumulative Estimated Net Inflows in the U.S. ETF Industry (in bn USD)
Source: LSEG Lipper
How About ETFs in Europe?
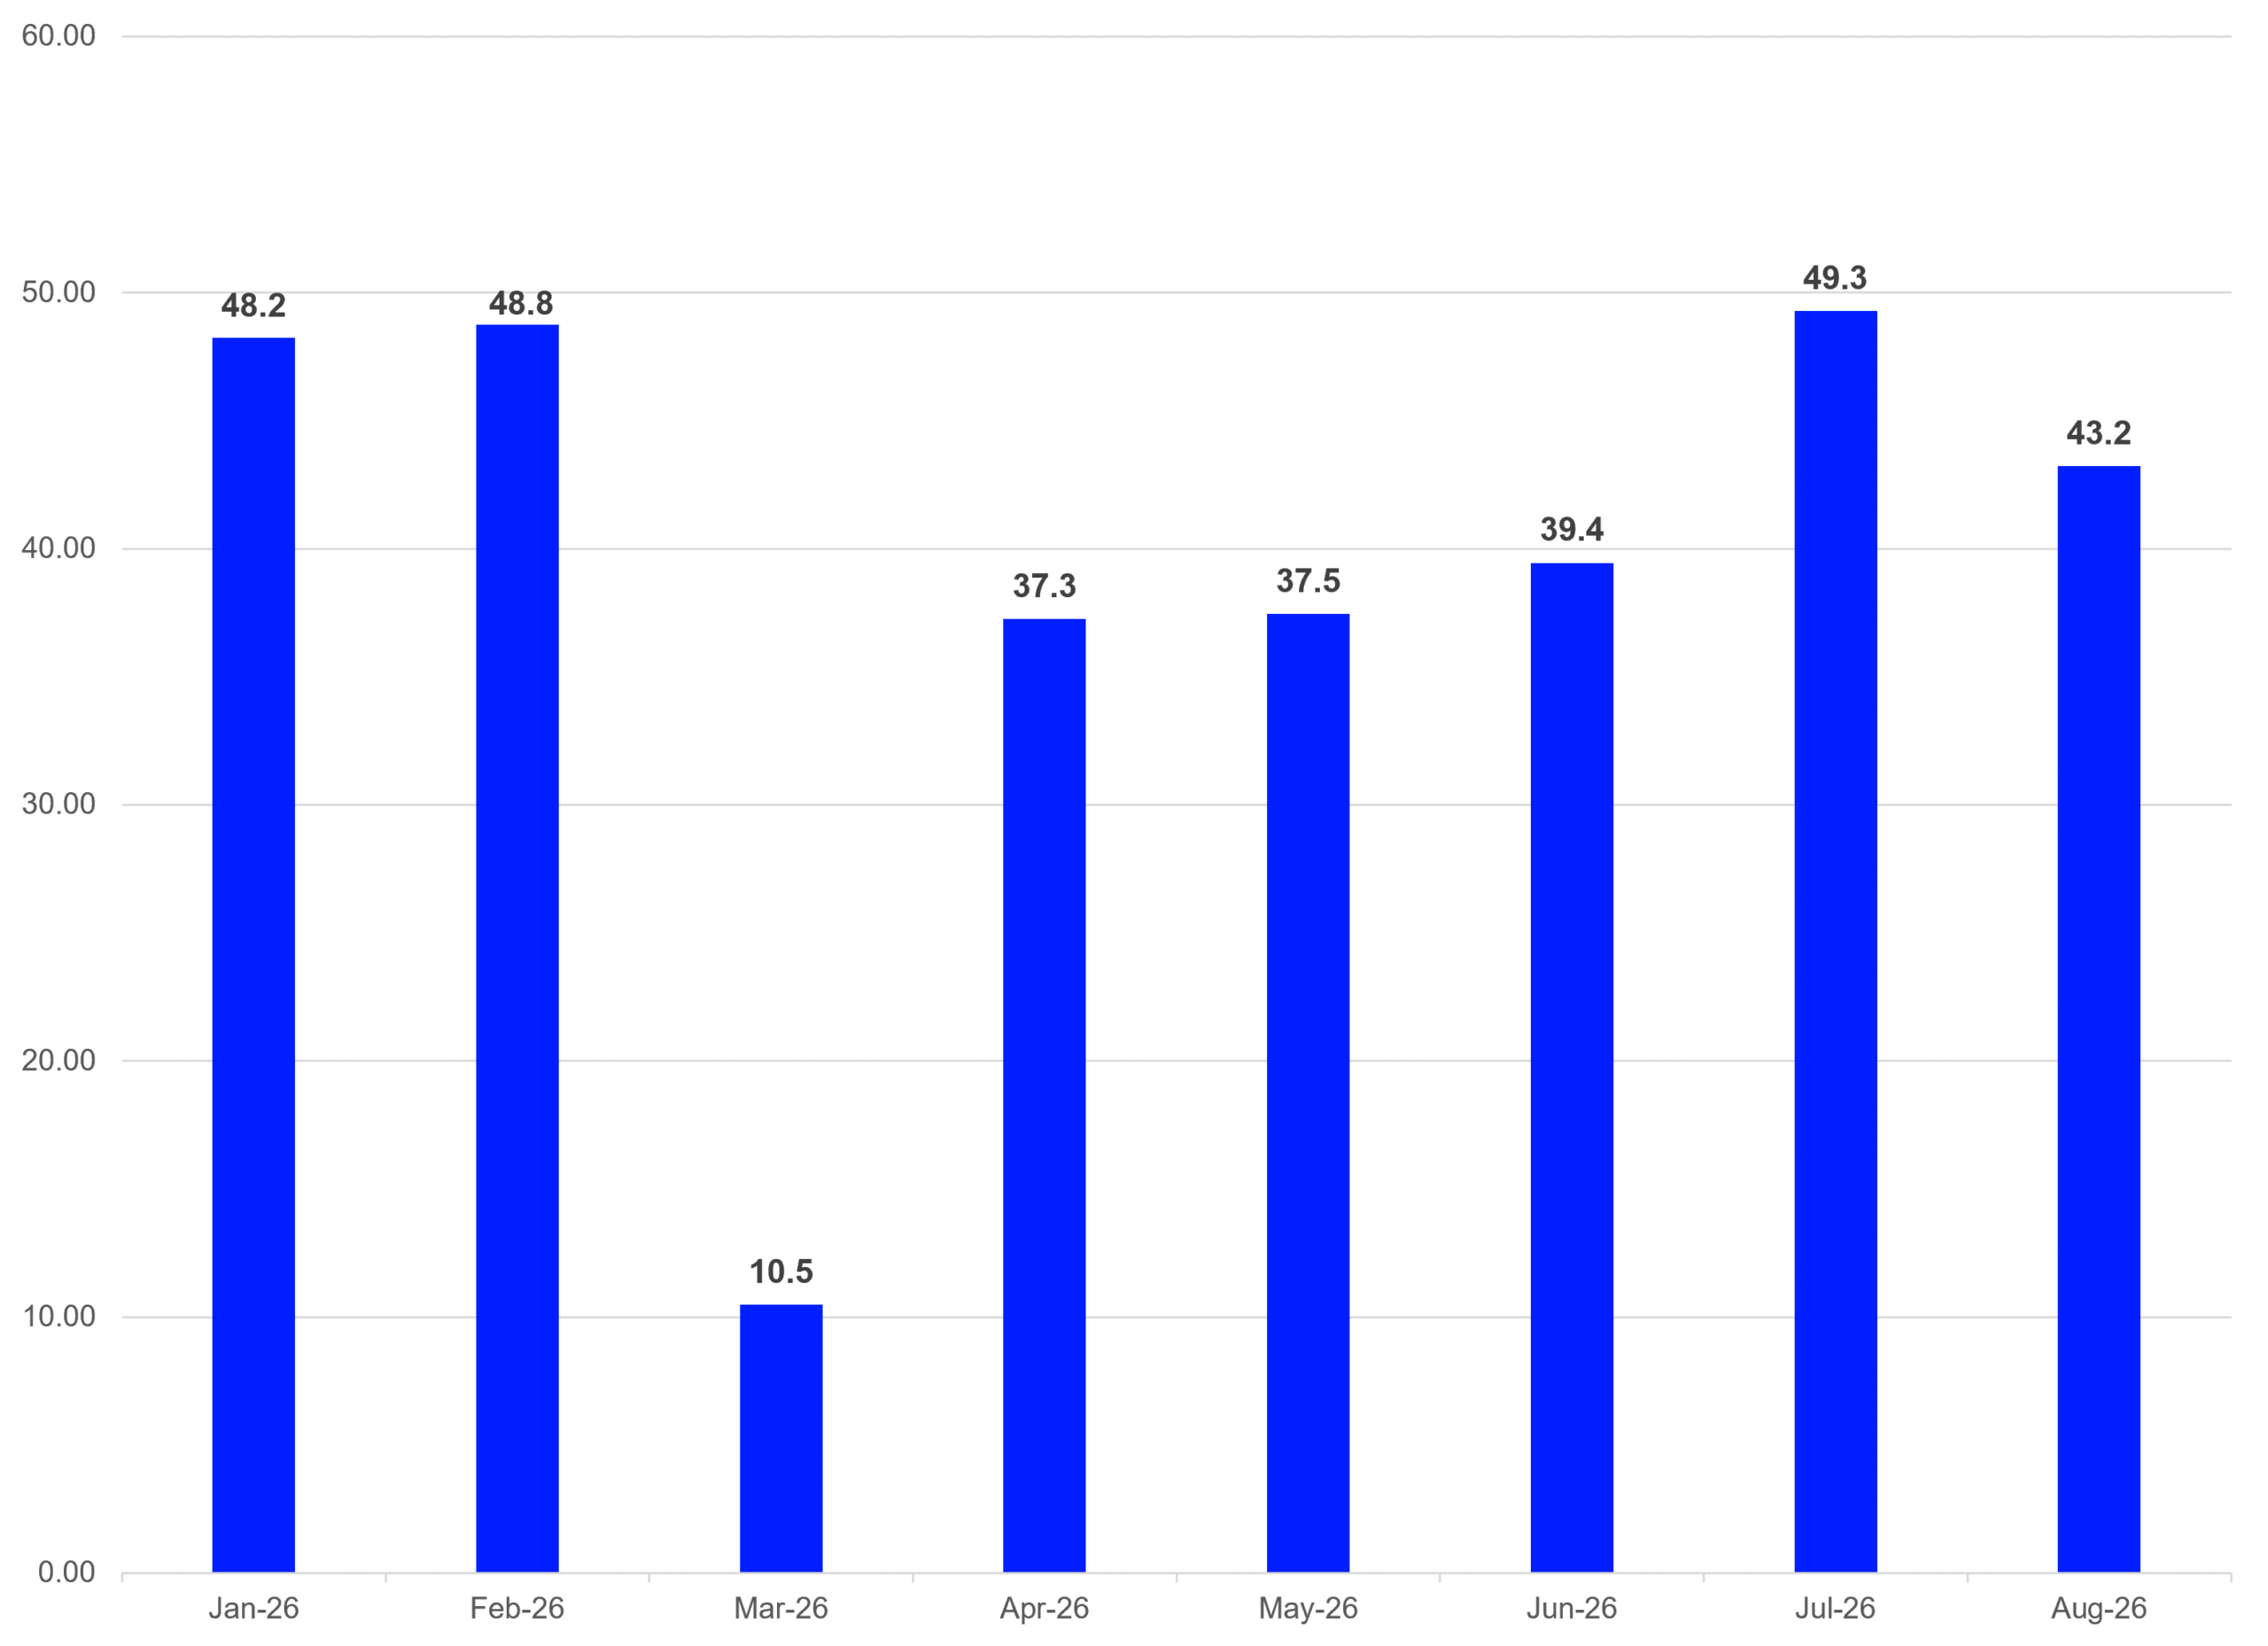
It is not surprising that the European ETF industry is much smaller than the U.S. ETF industry since ETFs were introduced in Europe seven years after these products first launched in the U.S. Nevertheless, ETFs in Europe gathered €39.3 bn on average per month over the course of the first eight months of 2026. These inflows are summing up to estimated net inflows of €314.1 bn for the year 2026 so far.
Graph 5: European ETF Industry – Monthly Estimated Net Flows 2026 (in bn EUR)
Source: LSEG Lipper
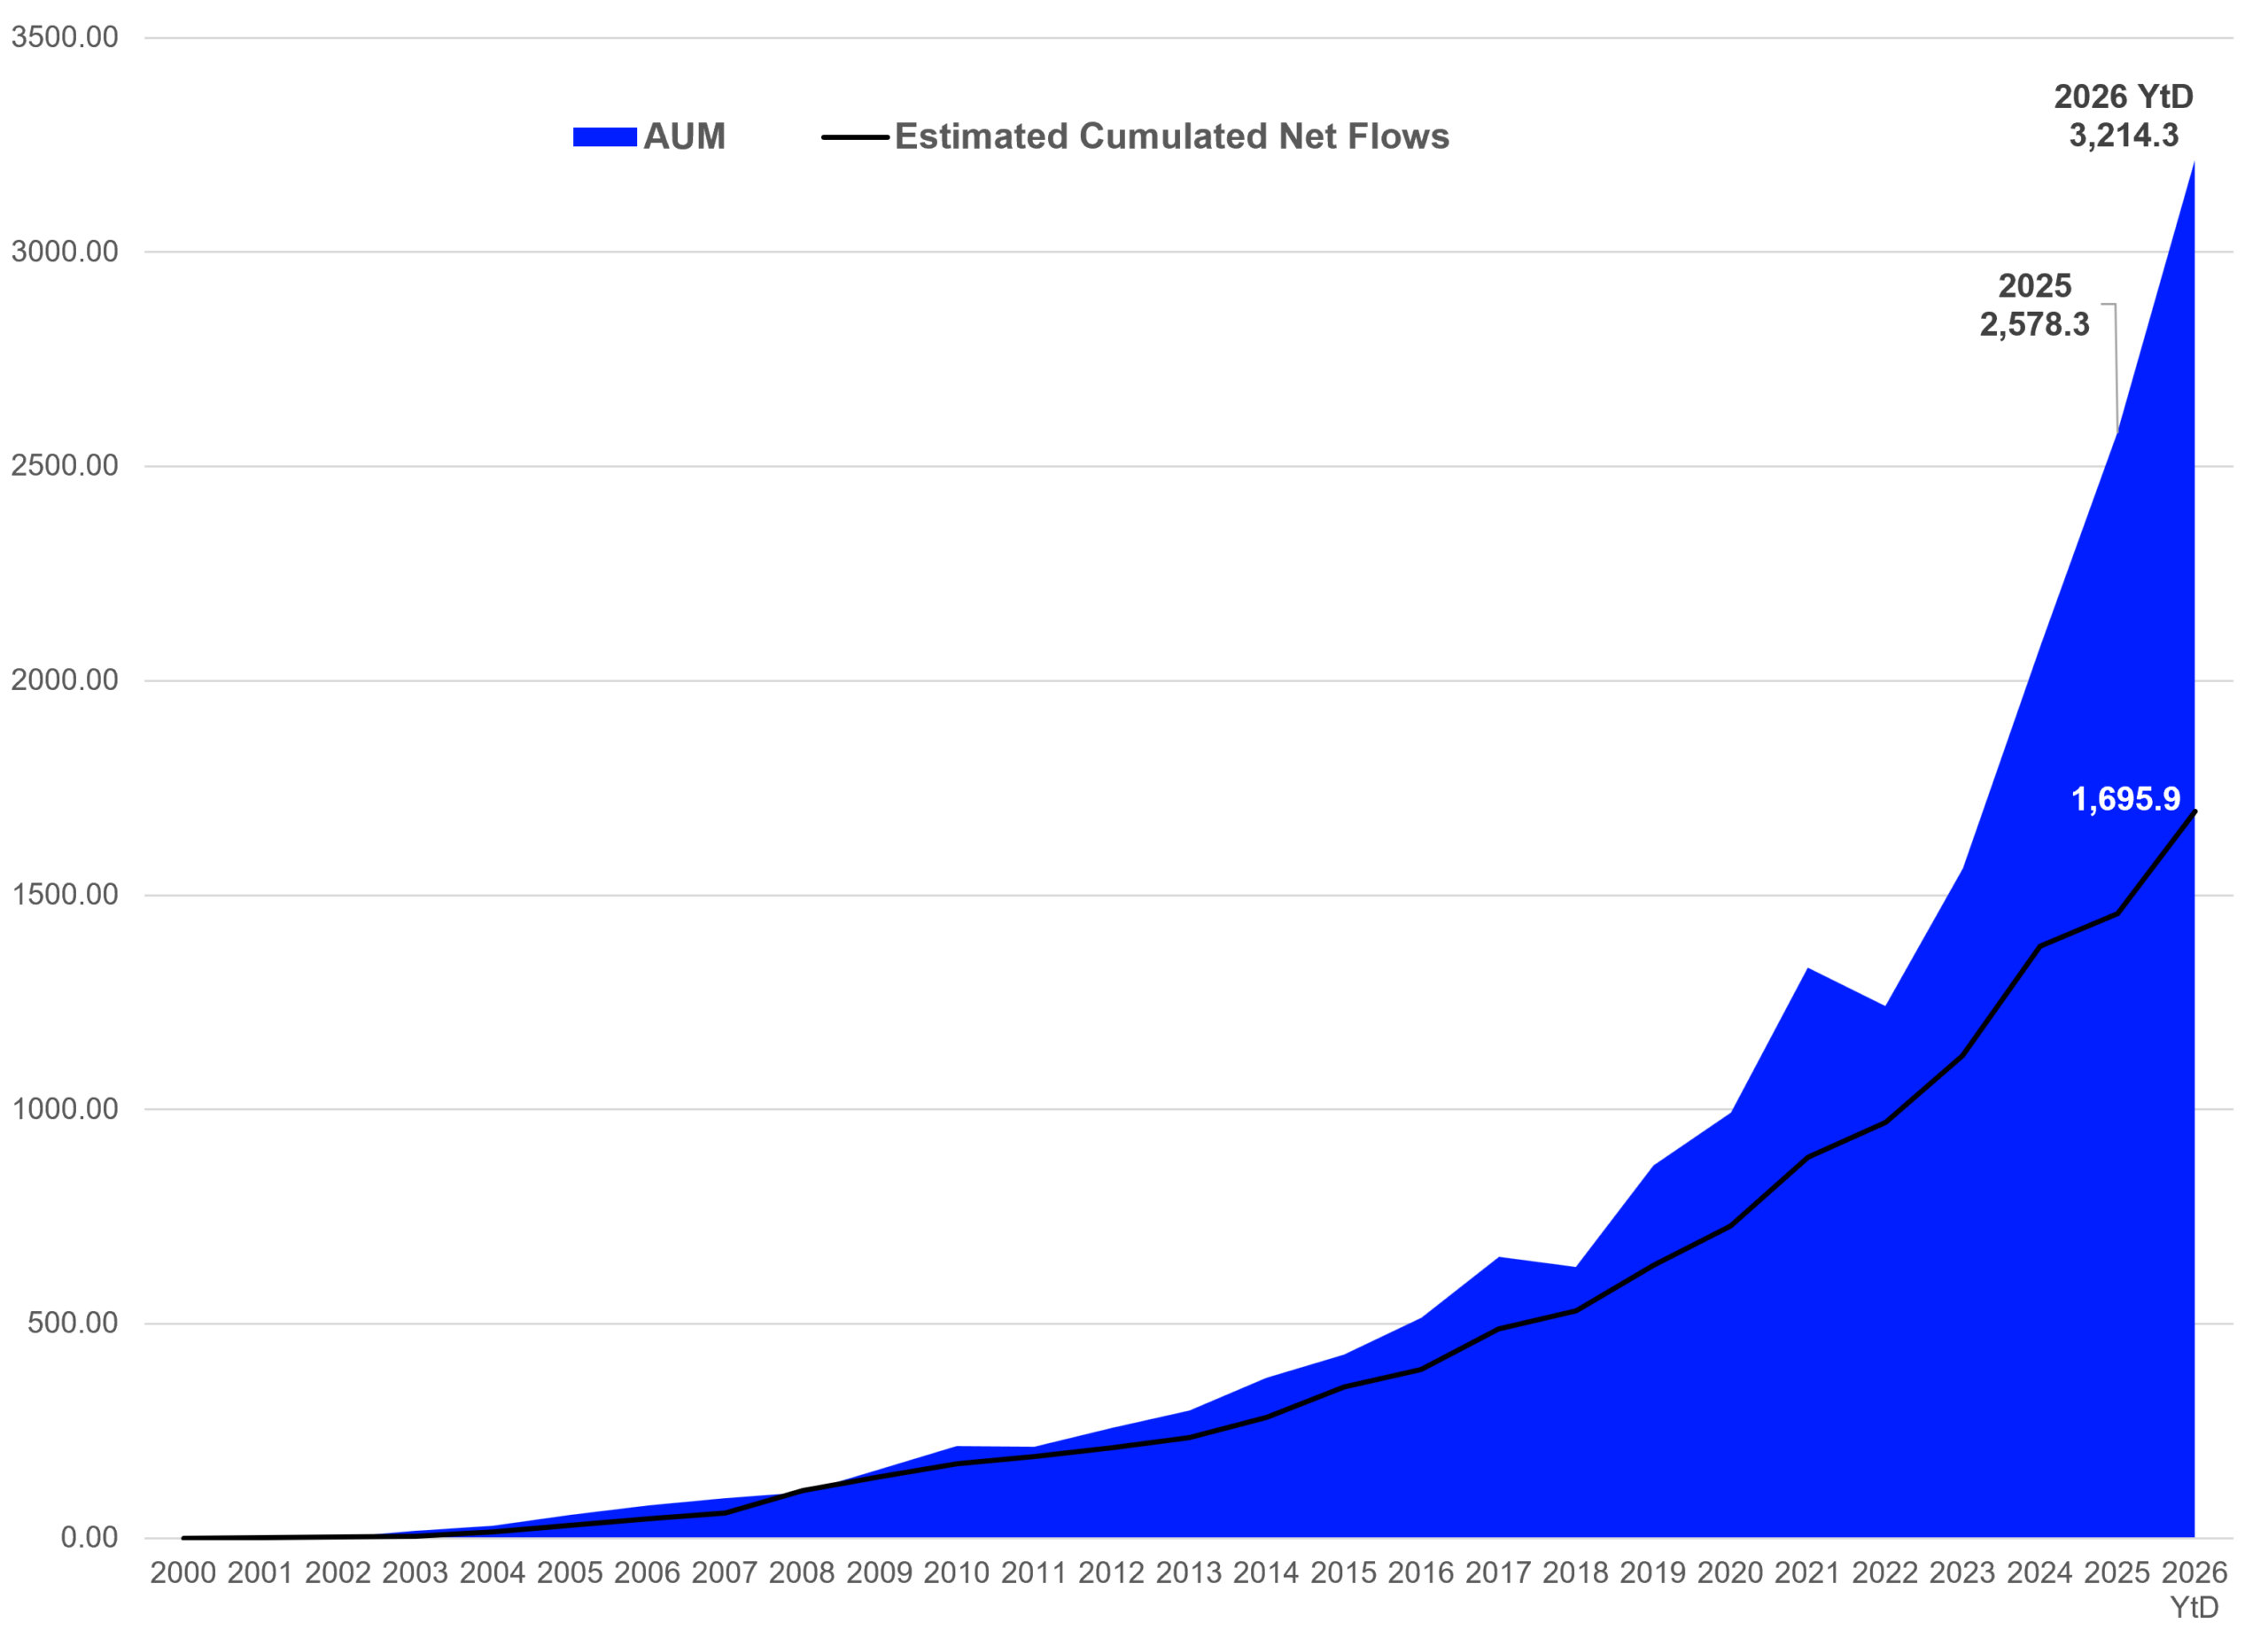
The current estimated average net inflows into ETFs in Europe are higher than the overall assets under management held by ETFs in October 2005 (€37.6 bn), while the overall estimated net flows for 2026 so far are higher than the overall assets under management held by ETFs domiciled Europe in April 2014 (€306.5 bn).
Graph 6: Assets Under Management and Cumulative Estimated Net Inflows in the European ETF Industry (in bn EUR)
Source: LSEG Lipper
Summary
Even as ETFs were seen as a possible success story for the financial industry when these products were launched at first, I don’t believe that any of the participants of the ETF ecosystem forecasted the success of ETFs around the globe correctly.
Graph 7: Global ETF Industry – Cumulative Estimated Net Flows per Calendar Year (in bn USD)
Source: LSEG Lipper
From my point of view the current level of estimated net inflows into ETFs is very impressive, as ETFs currently gather more money per month than they gathered over entire years in the past. Nevertheless, the success of ETFs becomes apparent when one compares the current fund flow numbers with those in the past, as it seems that very strong or even record high inflows have become the new normal for ETFs around the globe.



Comments
Log in or sign up to join the conversation.