

New data came out on industrial production and monthly GDP over the last couple days. That allows us to update the picture of key indicators that the NBER Business Cycle Dating Committee focuses on continues to paint an ambiguous picture.
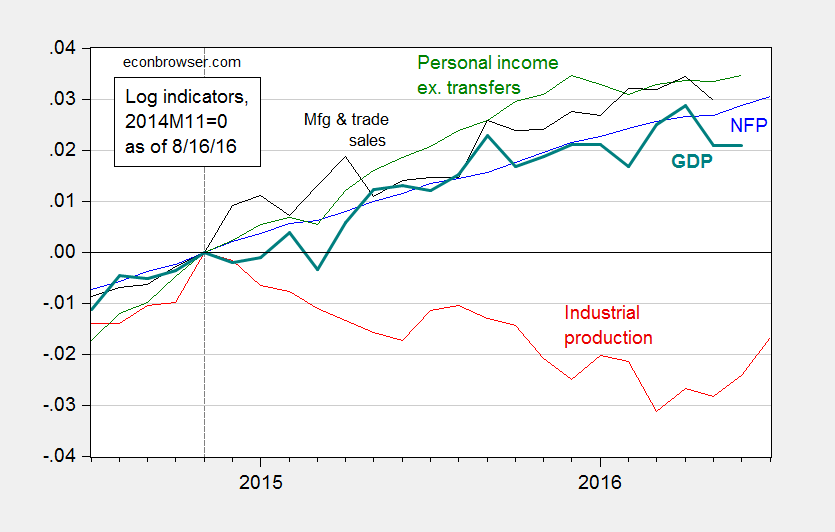
Figure 1: Log nonfarm payroll employment (blue), industrial production (red), personal income excluding transfers, in Ch.2009$ (green), manufacturing and trade sales, in Ch.2009$ (black), and Macroeconomic Advisers monthly GDP series (bold teal), all normalized to 2014M11=0, all as of August 16. Source: BLS (July release), Federal Reserve (June release), Macroeconomic Advisers (August 16), and author’s calculations.
Industrial production is now detectably trending upward. In terms of the tradables sector, manufacturing is also recovering, mitigating some of the concern of external drag.
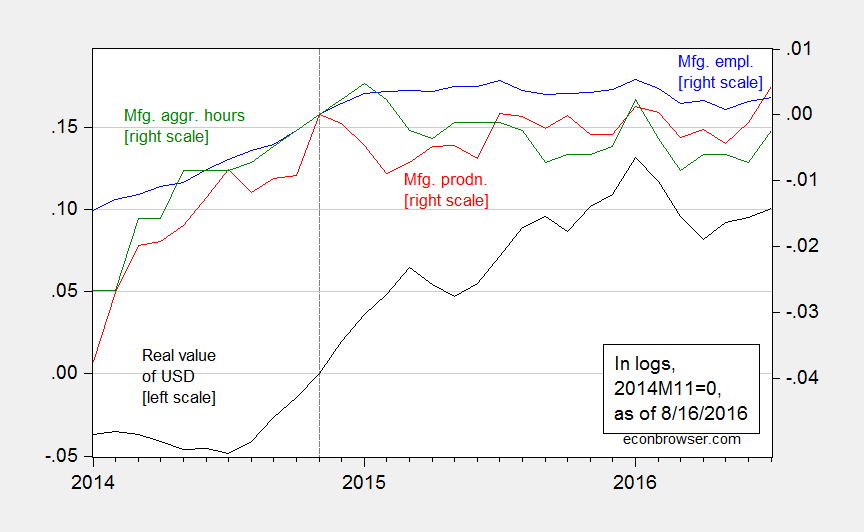
Figure 2: Real value of the US dollar against broad basket (black, left scale), manufacturing production (red, right scale), manufacturing employment (blue, right scale), aggregate hours index for manufacturing production and nonsupervisory workers, all in logs, 2014M11=0. Source: Federal Reserve Board, BLS, and author’s calculations.


Comments
Log in or sign up to join the conversation.